USD
- The Fed left interest rates unchanged as expected at the last meeting with basically no
change to the statement. The Dot Plot still showed three rate cuts for 2024 and
the economic projections were upgraded with growth and inflation higher and the
unemployment rate lower. - The US CPI beat expectations for the third
consecutive month, while the US PPI came in line with forecasts. - The US NFP beat expectations across the board
although the average hourly earnings came in line with forecasts. - The US PMIs missed expectations in April with the
commentary citing lower inflationary pressures but also increased layoffs. - The US Retail Sales beat expectations across the board by a
big margin with positive revisions to the prior figures. - The market expects the first rate cut in
September.
GBP
- The BoE left interest rates unchanged as expected but with Haskel and
Mann this time voting for a hold instead of a hike. - The employment report missed expectations with a big jump
in the unemployment rate although the wage growth increased. - The UK CPI beat expectations with Services inflation
remaining sticky, which continues to support the BoE’s patient stance. - The latest UK PMIs showed the Services PMI beating expectations
and the Manufacturing PMI missing forecasts and slipping back into contraction. - The UK Retail Sales missed expectations across the
board. - The market expects the first rate
cut in August.
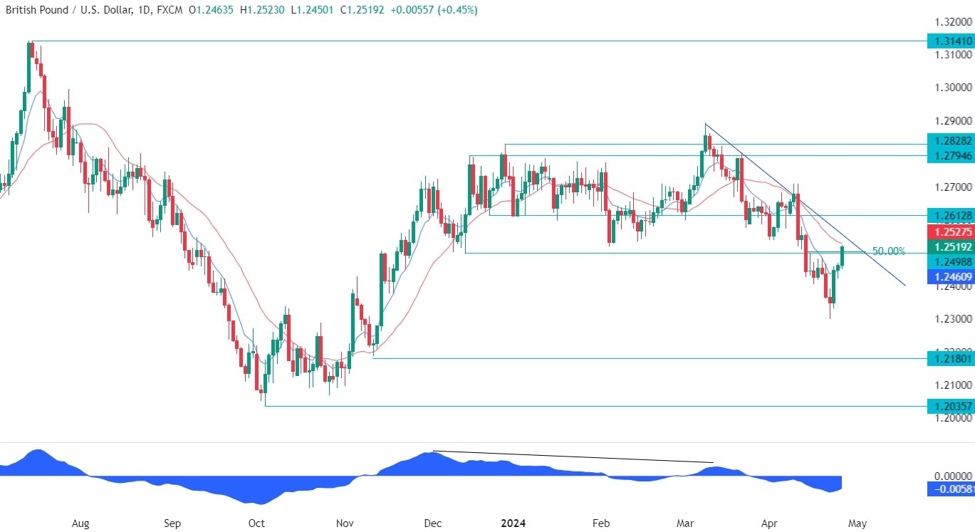
GBPUSD Technical Analysis –
Daily Timeframe
GBPUSD Daily
On the daily chart, we can see that GBPUSD pulled
back into a cluster of resistance levels around the 1.25 handle where we can find
the confluence of the
50% Fibonacci retracement level, the
red 21 moving average and the trendline.
This is where we can expect the sellers to step in with a defined risk above
the trendline to position for a drop into new lows. The buyers, on the other
hand, will want to see the price breaking higher to invalidate the bearish
setup and increase the bullish bets into the 1.28 handle.
GBPUSD Technical Analysis –
4 hour Timeframe
GBPUSD 4 hour
On the 4 hour chart, we can see that the price recently
broke through the minor downward trendline and the resistance zone
around the 1.24 handle and triggered a bullish move into the 1.25 handle as the
buyers piled in more aggressively. What happens around the 1.25 resistance and
the major trendline will be key as it will likely decide the direction for the
next few weeks.
GBPUSD Technical Analysis –
1 hour Timeframe
GBPUSD 1 hour
On the 1 hour chart, we can see that the
latest leg higher into the resistance is diverging with
the MACD. This
is generally a sign of weakening momentum often followed by pullbacks or
reversals. In this case, it might be a signal for a rejection and should give
the sellers even more conviction for a move lower. If the price breaks below
the black counter-trendline and the support zone around the 1.2460 level, it
will be a confirmation for a reversal and will likely trigger a strong bearish
move into new lows.
Upcoming Events
Today we get the US Q1 GDP and the latest US Jobless
Claims figures. Tomorrow, we conclude the week with the US PCE report.