USD
- The Fed left interest rates unchanged as expected at the last meeting with basically no
change to the statement. The Dot Plot still showed three rate cuts for 2024 and
the economic projections were upgraded with growth and inflation higher and the
unemployment rate lower. - The US CPI beat expectations for the third
consecutive month, while the US PPI came in line with forecasts. - The US NFP beat expectations across the board
although the average hourly earnings came in line with forecasts. - The US ISM Manufacturing PMI beat expectations by a big margin with
the prices component continuing to increase, while the US ISM Services PMI missed with the price index dropping to
the lowest level in 4 years. - The US Retail Sales beat expectations across the board by a
big margin with positive revisions to the prior figures. - The market now expects the first rate cut in
September.
CAD
- The BoC left interest rates unchanged at
5.00% as expected changing a line in the statement that indicated less concern
about inflation and thus the possibility of a cut in June if the trend remains
intact. - The latest Canadian CPI came in line with expectations although
the underlying inflation measures eased further. - On the labour market side, the latest report missed
expectations across the board although we saw an uptick in wage growth which is
something that the BoC is watching closely. - The Canadian Manufacturing PMI
improved slightly in March while the Services PMI weakened further. Both the
measures remain in contractionary territory. - The market expects the first rate
cut in June.
USDCAD Technical Analysis –
Daily Timeframe
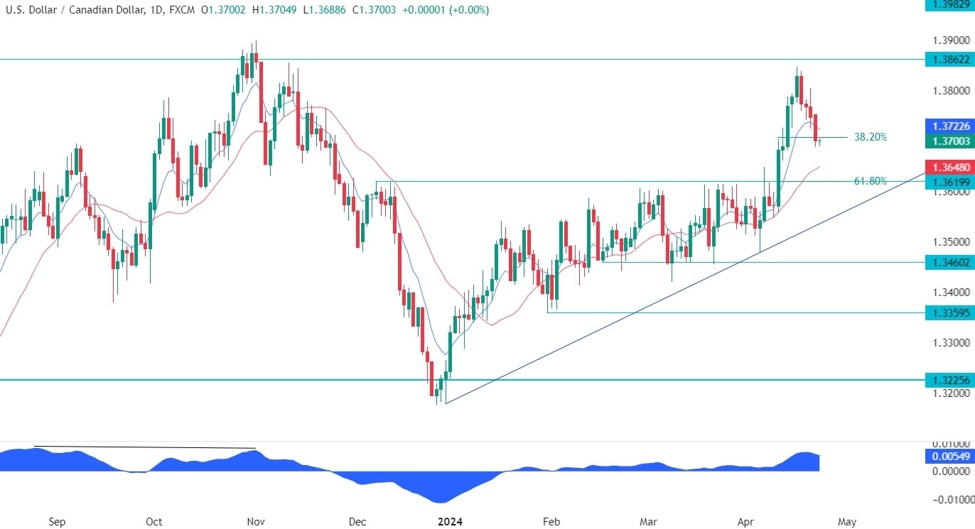
USDCAD Daily
On the daily chart, we can see that USDCAD came
close to the top of the one-year range around the 1.3862 level but eventually
rolled off back into the 1.37 handle. We can see that from a risk management
perspective, the buyers will have a much better risk to reward setup around the
1.3620 level where we can find the confluence of the
previous resistance turned support and the
61.8% Fibonacci retracement level.
The sellers, on the other hand, will want to see the price breaking below the
major trendline to turn
the trend around and target a drop all the way back to the bottom of the range
around the 1.3225 level.
USDCAD Technical Analysis –
4 hour Timeframe
USDCAD 4 hour
On the 4 hour chart, we can see that the price
yesterday broke below the minor upward trendline turning the bias more bearish
and opening the door for a drop into the 1.3620 support. We now
have a minor downward trendline and the red 21 moving average defining
the current bearish momentum. This is where we can expect the sellers to step
in with a defined risk above the trendline to position for a drop into the
1.3620 support with a better risk to reward setup. The buyers, on the other
hand, will want to see the price breaking higher to invalidate the bearish
setup and position for a rally into new highs.
USDCAD Technical Analysis –
1 hour Timeframe
USDCAD 1 hour
On the 1 hour chart, we can see that we
have also the Fibonacci retracement levels on this timeframe adding some extra
confluence to the bearish setup around the trendline. Watch out for the US
Flash PMIs data today because it will be a market moving event.
Upcoming Events
Today we get the US Flash PMIs. Tomorrow, we have
the Canadian Retail Sales. On Thursday we will see the latest US Jobless Claims
figures, while on Friday we conclude the week with the US PCE report.