The major US stock indices are tilting back to the downside with the three major indices now down around -0.45% to -0.55%.
A snapshot of the market currently shows:
- Dow industrial average -216.30 or -0.56% at 38676.88
- S&P index -27.16 points or -0.53% at 5174.98
- NASDAQ index -75.57 points or -0.47% at 16177.50
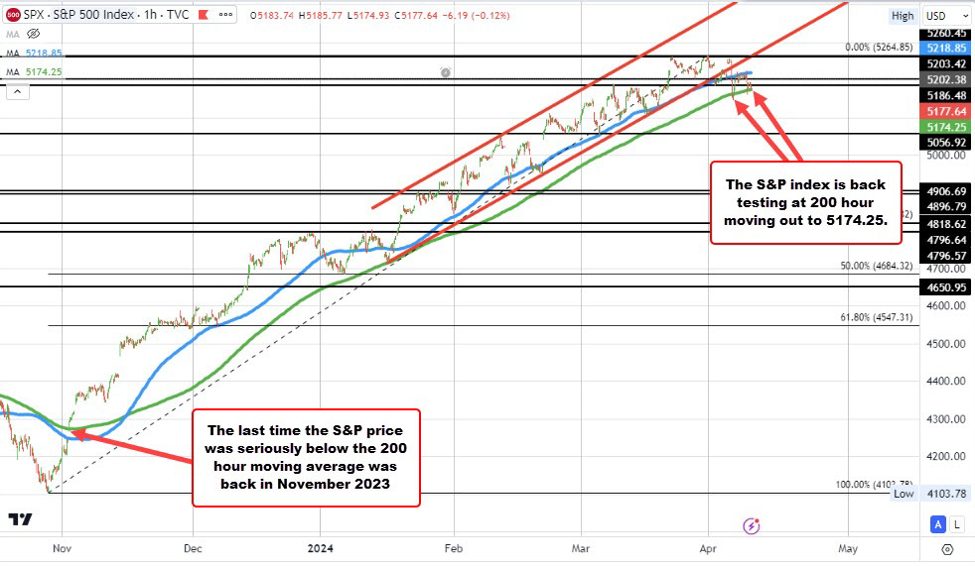
Looking at the hourly chart of the S&P index, the price is back down testing its 200-hour moving average at 5174.25. On April 4, the price fell below the moving average but only for an hour or two. Earlier today the price was back below the moving average but it too bounced back higher.
A break below the level – and staying below the level – would be the first significant break since November 1, 2023.
S&P index retesting it’s a 200 hour moving average
Tomorrow US CPI will be released at 8:30 AM ET. The Fed minutes will be also announced at 2 PM ET.
This article was originally published by Forexlive.com. Read the original article here.