USD
- The Fed left interest rates unchanged as expected at the last meeting with basically no
change to the statement. The Dot Plot still showed three rate cuts for 2024 and
the economic projections were upgraded with growth and inflation higher and the
unemployment rate lower. - Fed Chair Powell maintained a neutral stance as he said that it was
premature to react to the recent inflation data given possible bumps on the way
to their 2% target. - The US CPI and the US PPI beat expectations for the second
consecutive month. - The US NFP beat expectations across the board
although the average hourly earnings came in line with forecasts. - The US ISM Manufacturing PMI beat expectations by a big margin with
the prices component continuing to increase, while the US ISM Services PMI missed with the price index dropping to
the lowest level in 4 years. - There’s now basically a 50/50 chance of a rate cut
in June.
GBP
- The BoE left interest rates unchanged as expected but with Haskel and
Mann this time voting for a hold instead of a hike. - The employment report missed expectations with an uptick
in the unemployment rate and an easing in wage growth. - The UK CPI missed expectations across the board but with
Services inflation remaining sticky, which continues to support the BoE’s
patient stance. - The latest UK PMIs showed the Services PMI missing expectations
slightly and the Manufacturing PMI beating. - The market expects the first rate
cut in June.
GBPUSD Technical Analysis –
Daily Timeframe
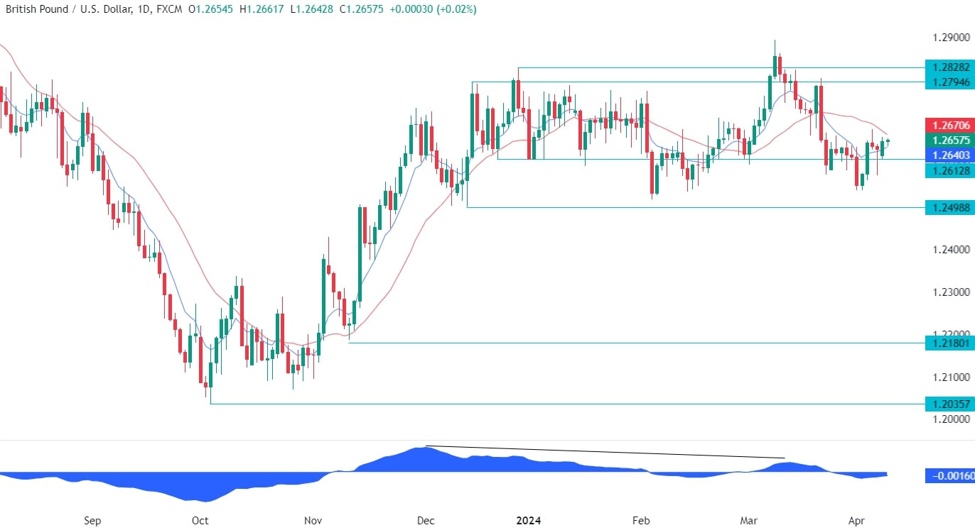
GBPUSD Daily
On the daily chart, we can see that GBPUSD is
trading right below the red 21 moving average around
the 1.2670 level as the market went into a bit of a consolidation ahead of the
US CPI report. We can expect the sellers to step in around these levels to
position for a drop into new lows, while the buyers will look for a break to
the upside to increase the bullish bets into the 1.28 resistance.
GBPUSD Technical Analysis –
4 hour Timeframe
GBPUSD 4 hour
On the 4 hour chart, we can see that we have a
strong resistance zone around the 1.2670 level where we can find the confluence of the
previous swing levels, the 50% Fibonacci retracement level,
the trendline and the
daily 21 moving average. This is where the sellers are likely to step in with a
defined risk above the trendline to position for a drop into new lows. The
buyers, on the other hand, will want to see the price breaking higher to
invalidate the bearish setup and increase the bullish bets into the 1.28
resistance.
GBPUSD Technical Analysis –
1 hour Timeframe
GBPUSD 1 hour
On the 1 hour chart, we can see that we
have also a counter-trendline and the red 21 moving average defining the
current short-term uptrend. The buyers might want to lean on the trendline with
a defined risk below it to position for a breakout with a better risk to reward
setup. The sellers, on the other hand, will want to see the price breaking
lower to increase the bearish bets into new lows.
Upcoming Events
Tomorrow we get the US CPI report and the FOMC Minutes.
On Thursday, we will have the US PPI and the latest US Jobless Claims figures.
On Friday, we conclude the week with the UK GDP and the University of Michigan
Consumer Sentiment Survey.