Oil prices have been moving up since late December 2023 and are now (for Brent) forming a ‘Golden Cross’. This is a sign that technical analysts like, when a shorter-term moving average (MA) crosses above a longer-term MA:
- 50 and 200 day simple moving averages (SMAs) are commonly used, but those parameters are not chiselled in stone somewhere
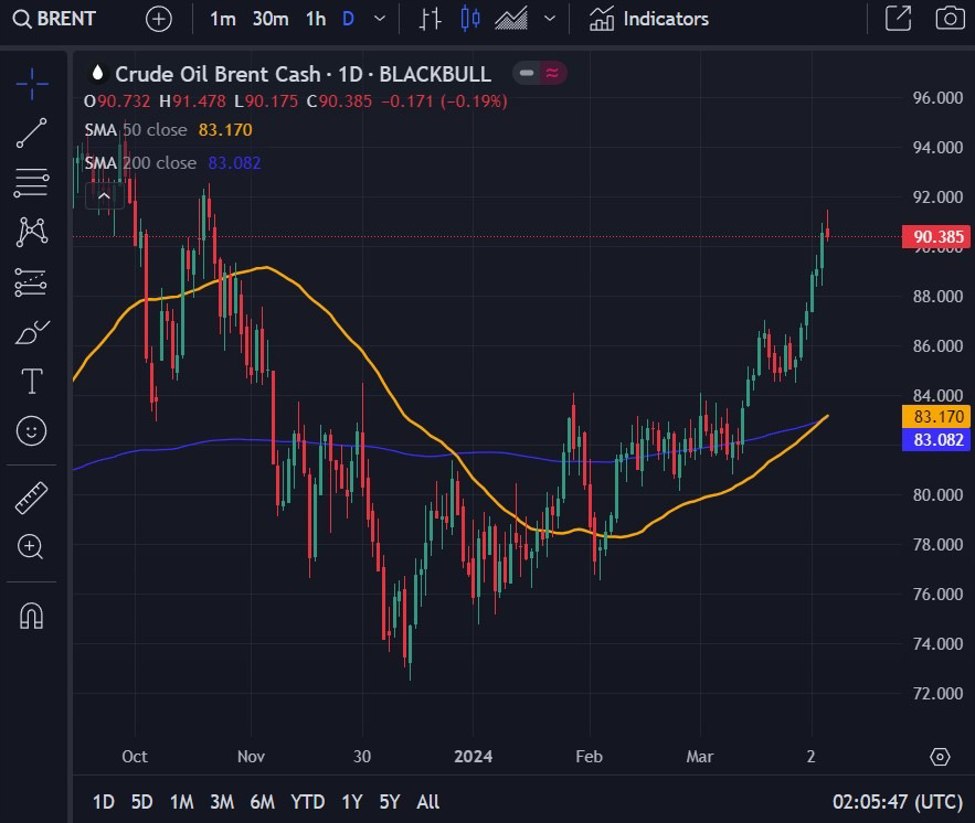
Brent has thrown out the signal now, WTI is not quite there. I’ve used the free charts on our site, that you can access here. Or of course, use your own charting program as you prefer.
Brent below. Check out the link the chart above and use the ‘BRENT’ code shown in the chart. Its not really visible on the screenshot below but around $91 there will be a lot of work to be done (ie resistance).
WTI:
This article was originally published by Forexlive.com. Read the original article here.