GBPUSD trades above the 100 day MA, but below 200 day MA.
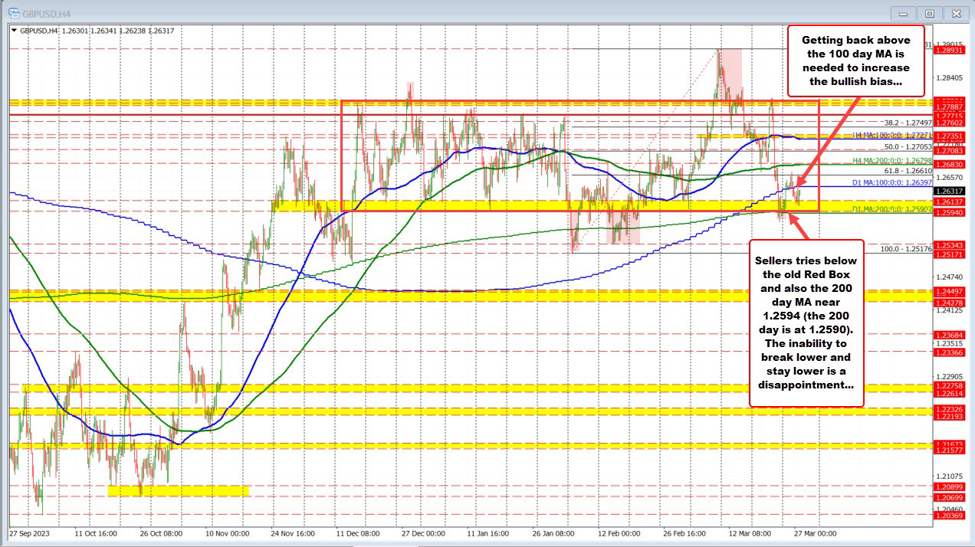
The GBPUSD last Friday moved below its 200-day MA (at 1.2590), and the low of a swing area between 1.2594 to 1.26137. That should have led to more selling momentum, but that did not happen. The price recovered higher.
On Monday, there was a try in the first 4-hour bar (on the chart above) but once again, momentum failed.
Since then, the price has reestablished its price action higher but above and below its 100 day MA (blue line at 1.26397 currently). The high price reached 1.2667 on Tuesday, but closed the day at 1.2627 – below the key 100-day MA.
Today, the price action has been able to stay entirely below the key 100-day MA. However, the lows for the day have been within the swing area down to 1.2594 and above the 200-day MA at 1.25902.
The current price is at 1.2633.
So technically close resistance is now at 1.26397 or the 100 day MA, and close support is below at the 200-day MA at 1.2590. Going forward, it will take a move outside those levels (higher or lower) to tilt the bias either more to the upside or more to the downside. In between those levels, and the technical bias is more neutral with buyers and sellers battling it out and waiting for the next shove. .However, with the price lower, the advantage to the sellers with risk focus buyers leaning against support (with a stop on a break below).