USD
- The Fed left interest rates unchanged as
expected with basically no change to the statement. The Dot Plot still showed
three rate cuts for 2024 and the economic projections were upgraded with growth
and inflation higher and the unemployment rate lower. - Fed Chair Powell
maintained a neutral stance as he said that it was premature to react to the
recent inflation data given possible bumps on the way to their 2% target. - The US CPI and
the US PPI beat
expectations for the second consecutive month. - The US Jobless Claims beat
expectations across the board. - The latest US Manufacturing
PMI
beat expectations while the Services PMI missed slightly. Both the measures
remain in expansion though. - The market expects the first rate cut in June.
GBP
- The BoE left interest rates unchanged as expected but with Haskel and
Mann this time voting for a hold instead of a hike. - The employment report missed expectations with an uptick
in the unemployment rate and an easing in wage growth. - The UK CPI missed expectations across the board but with
Services inflation remaining sticky, which continues to support the BoE’s
patient stance. - The latest UK PMIs showed the Services PMI missing expectations
slightly and the Manufacturing PMI beating. - The market expects the first rate
cut in June.
GBPUSD Technical Analysis –
Daily Timeframe
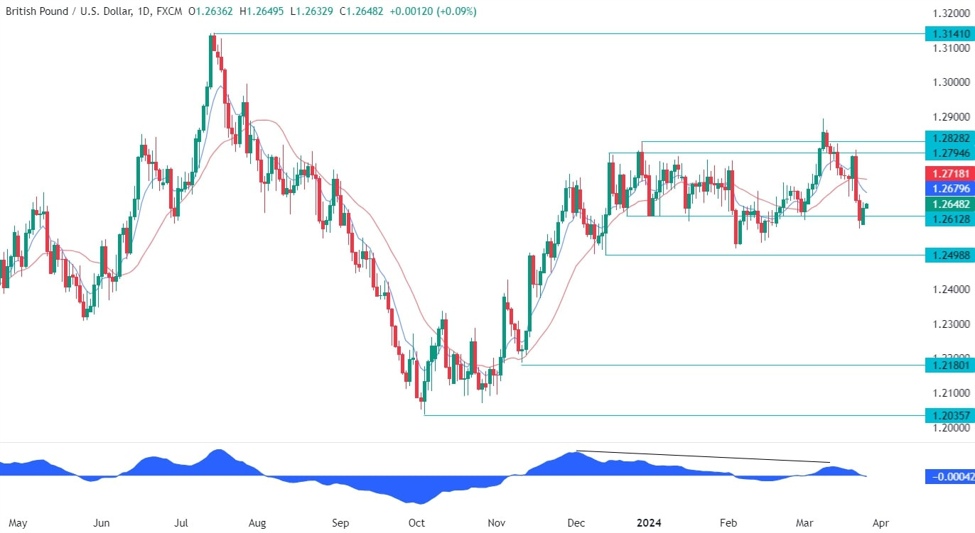
GBPUSD Daily
On the daily chart, we can see that GBPUSD sold off
hard from the top of the range around the 1.28 handle before bouncing around
the 1.26 handle. The price got a bit overstretched as depicted by the distance
from the bleu 8 moving average. In such
instances, we can generally see a pullback into the moving average or some
consolidation before the next move.
GBPUSD Technical Analysis –
4 hour Timeframe
GBPUSD 4 hour
On the 4 hour chart, we can see that the price is
approaching the previous swing low level around the 1.2667 level where we can
also find the confluence of the
38.2% Fibonacci retracement level
and the red 21 moving average. This is where we can expect the sellers to step
in with a defined risk above the Fibonacci level to position for a drop into
the 1.25 handle. The buyers, on the other hand, will want to see the price
breaking higher to increase the bullish bets into the 1.28 handle.
GBPUSD Technical Analysis –
1 hour Timeframe
GBPUSD 1 hour
On the 1 hour chart, we can see that we
have now a counter-trendline where
we can expect the buyers to lean onto in case we get a pullback. The sellers,
on the other hand, will want to see the price breaking lower to increase the
bearish bets into the 1.25 handle.
Upcoming Events
Today we have the US Durable Goods Orders and the US
Consumer Confidence report. Tomorrow, we have Fed’s Waller speaking. On
Thursday, we get the latest US Jobless Claims figures, while on Friday we
conclude with the US PCE and Fed Chair Powell.