USD
- The Fed left interest rates unchanged as
expected with basically no change to the statement. The Dot Plot still showed
three rate cuts for 2024 and the economic projections were upgraded with growth
and inflation higher and the unemployment rate lower. - Fed Chair Powell
maintained a neutral stance as he said that it was premature to react to the
recent inflation data given possible bumps on the way to their 2% target. - The US CPI and
the US PPI beat
expectations for the second consecutive month. - The US Jobless Claims beat
expectations across the board. - The latest US Manufacturing
PMI
beat expectations while the Services PMI missed slightly. Both the measures
remain in expansion though. - The market expects the first rate cut in June.
CAD
- The BoC left interest rates unchanged at
5.00% as expected stating that further easing in underlying inflation is needed. - The latest Canadian CPI missed expectations across the
board with the underlying inflation measures falling. - On the labour market side, the latest report beat
expectations but we saw a fall in wage growth which is something that the BoC
is watching closely. - The Canadian PMIs improved in February
although they remain both in contractionary territory. - The market expects the first rate
cut in June.
USDCAD Technical Analysis –
Daily Timeframe
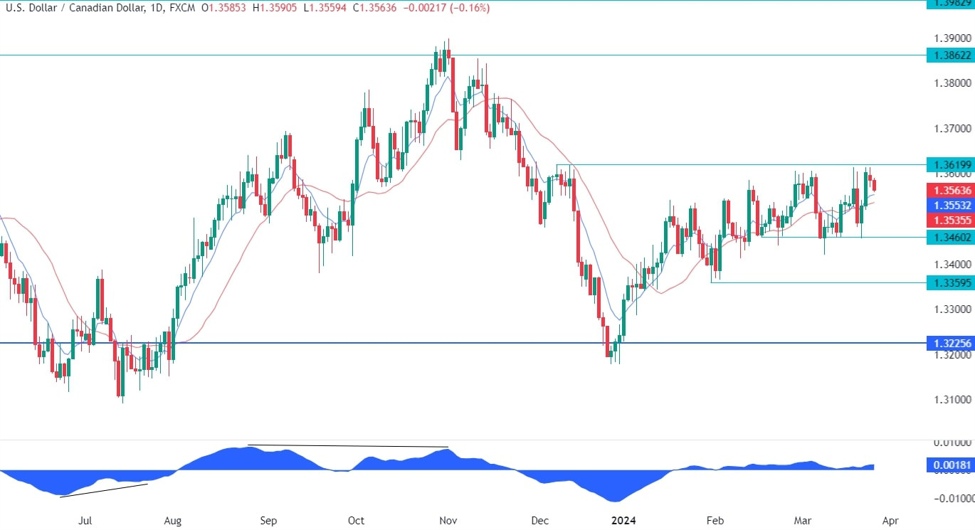
USDCAD Daily
On the daily chart, we can see that USDCAD tested
once again the key 1.3620 level but failed to extend the rally above it. The
price got a bit overstretched as depicted by the distance from the blue 8 moving average. In such
instances, we can generally see a pullback into the moving average or some
consolidation before the next move.
USDCAD Technical Analysis –
4 hour Timeframe
USDCAD 4 hour
On the 4 hour chart, we can see that the pair is
now stuck in a range between the 1.3620 resistance and the
1.3450 support. Market participants will likely keep “playing the range” by
selling at resistance and buying at support until we get a breakout supported
by a fundamental catalyst. The price is now approaching a support zone around
the 1.3550 level where we can find the confluence of the
38.2% Fibonacci retracement level
and the red 21 moving average. This is where we can expect the buyers to step
in with a defined risk below the support to position for a break above the
1.3620 level. The sellers, on the other hand, will want to see the price
breaking lower to increase the bearish bets into the 1.3450 support.
USDCAD Technical Analysis –
1 hour Timeframe
USDCAD 1 hour
On the 1 hour chart, we can see that we
have a counter-trendline
defining the current short-term downtrend with the red 21 moving average acting
as dynamic resistance. If the price were to break above the trendline, we can
expect the buyers to pile in to position for a rally into the resistance
targeting a breakout.
Upcoming Events
Today we have the US Durable Goods Orders and the US
Consumer Confidence report. Tomorrow, we have Fed’s Waller speaking. On
Thursday, we get the latest US Jobless Claims figures, while on Friday we
conclude with the US PCE and Fed Chair Powell.