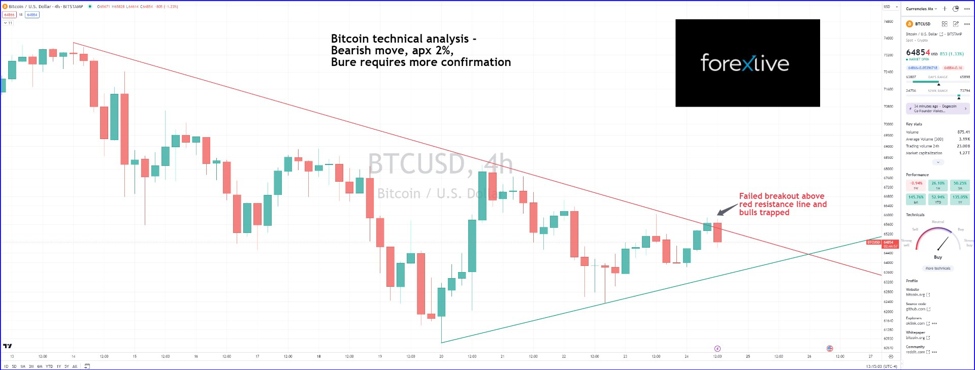
BTCUSD 4 hourly chart shows a failed breakout
Bitcoin’s recent price action on the 4-hour chart presents a fascinating narrative of a failed breakout, highlighting the constant battle between bulls and bears in the cryptocurrency market. Here’s an in-depth look at the technical analysis of Bitcoin’s performance and what traders might anticipate next.
Bitcoin’s Failed Breakout: A Test of Resolve for Bulls
Bitcoin, the leading cryptocurrency, recently gave traders a jolt of excitement as it attempted to break above a key resistance level. However, this breakout proved to be a bull trap, with the price retreating back below the red resistance line. The market’s reaction to this failed breakout is critical for investors and traders alike, as it could dictate the short-term directional bias.
The Technical Breakdown for Bitcoin now:
- After a period of consolidation, Bitcoin bulls charged towards the red resistance line, only to face a staunch defense from bears.
- The price formed what appeared to be a breakout, enticing bullish traders to anticipate a continuation of the upward trend.
- Unfortunately for buyers, the breakout didn’t sustain, turning into a classic bull trap as the price sharply reversed, leaving buyers stranded.
What’s Next for Bitcoin?
- Potential Support Retest: The recent bearish move, approximately 2% from the resistance line, signals that Bitcoin may be headed for a retest of the green support line situated near $63,500.
- Key Level to Watch: The $63,500 level represents not just a psychological round figure but also a technical support level that has held firm on multiple occasions.
Market Sentiment: A Mixed Bag
- Bears in Temporary Control: The failed breakout indicates that bears have not relinquished control yet, and the immediate trend seems to favor them.
- Bulls Need More Confirmation: For bullish traders, it’s a time for patience and seeking confirmation signals before re-entering the market.
- Confirmation Signals: Such signals could include a bounce off the green support line with increased volume or a bullish reversal pattern.
Strategic Outlook for Traders:
- For Conservative Traders: Wait for a clear signal that the support line holds with bullish confirmation before considering long positions.
- For Aggressive Traders: Some may view this as an opportunity to short, speculating that the price will continue to descend towards the support line.
Conclusion:
The dynamics of Bitcoin trading are ever-changing, and the failed breakout on the 4-hour chart is a stark reminder of the volatility and uncertainty inherent in cryptocurrency markets. Whether Bitcoin will bounce back or continue its descent is a question only time will answer. For now, traders should brace for a potential test of the green support line and prepare their strategies accordingly. Stay vigilant, keep an eye on the key levels, and trade with discipline.
Remember: Cryptocurrency investments are subject to high market risk. Please make your trades cautiously. Bitcoin is a volatile asset, and around-the-clock trading provides constant opportunities for both big gains and significant losses.