
- Lululemon Athletica plunges below $400.
- Full-year guidance cut to $250 million below consensus.
- LULU stock halts fall near long-time support at $386.50.
- Q4 earnings and revenue arrive above consensus.
A Wall Street favorite, Lululemon Athletica (LULU) stock was dashed against the rocks on Friday due to management’s lower outlook for revenue in the current year. The athleisure stock fell more than 18% at one point to $387, dropping below $400 for the first time since last November.
Call it a case of expectations getting too far ahead of the curve. Lululemon beat consensus forecasts for the fourth quarter, but that just wasn’t enough to satisfy the bulls.
The market opened slightly lower on Friday as it digests the previous two days of gains following Federal Reserve Chair Jerome Powell’s press conference in which he remained committed to cutting interest rates this year despite recent hints of inflation in the US economy.
Lululemon Athletica stock news
The primary factor in Friday’s sell-off was that the athleisure brand’s management released their 2024 full-year sales outlook. It came in a range from $10.7 to $10.8 billion, which was well below the $11 billion consensus from Wall Street analysts.
For the current quarter, Q1, management said sales would reach $2.18 to $2.2 billion, which was likewise below the $2.26 billion consensus. Essentially, this means that revenue is staying largely flat from recent quarters in mid-2023, but the guidance would still outflank Q1 2023 (fiscal Q1 2024) by about 9%.
Lululemon opened 25 new stores during the fourth quarter, which ended in December, and ended the period with a total of 711 stores.
In the fourth quarter, Lululemon earned $5.29 in GAAP earnings per share, which beat consensus by more than 5%. Revenue of $3.21 billion rose 16% YoY, besting consensus by a slight $10 million.
The rise in sales during Q4 was largely attributed to a 54% increase in international revenue. Overall, same store sales rose 12% YoY in the fourth quarter.
Nasdaq FAQs
The Nasdaq is a stock exchange based in the US that started out life as an electronic stock quotation machine. At first, the Nasdaq only provided quotations for over-the-counter (OTC) stocks but later it became an exchange too. By 1991, the Nasdaq had grown to account for 46% of the entire US securities’ market. In 1998, it became the first stock exchange in the US to provide online trading. The Nasdaq also produces several indices, the most comprehensive of which is the Nasdaq Composite representing all 2,500-plus stocks on the Nasdaq, and the Nasdaq 100.
The Nasdaq 100 is a large-cap index made up of 100 non-financial companies from the Nasdaq stock exchange. Although it only includes a fraction of the thousands of stocks in the Nasdaq, it accounts for over 90% of the movement. The influence of each company on the index is market-cap weighted. The Nasdaq 100 includes companies with a significant focus on technology although it also encompasses companies from other industries and from outside the US. The average annual return of the Nasdaq 100 has been 17.23% since 1986.
There are a number of ways to trade the Nasdaq 100. Most retail brokers and spread betting platforms offer bets using Contracts for Difference (CFD). For longer-term investors, Exchange-Traded Funds (ETFs) trade like shares that mimic the movement of the index without the investor needing to buy all 100 constituent companies. An example ETF is the Invesco QQQ Trust (QQQ). Nasdaq 100 futures contracts allow traders to speculate on the future direction of the index. Options provide the right, but not the obligation, to buy or sell the Nasdaq 100 at a specific price (strike price) in the future.
Many different factors drive the Nasdaq 100 but mainly it is the aggregate performance of the component companies revealed in their quarterly and annual company earnings reports. US and global macroeconomic data also contributes as it impacts on investor sentiment, which if positive drives gains. The level of interest rates, set by the Federal Reserve (Fed), also influences the Nasdaq 100 as it affects the cost of credit, on which many corporations are heavily reliant. As such the level of inflation can be a major driver too as well as other metrics which impact on the decisions of the Fed.
Lululemon stock forecast
LULU stock halted its sell-off at an intraday low on Friday of $387.11. That is a good sign for worried shareholders and also seems to have beckoned bulls to enter there as the price rebounded off that low. This is because the $386.50 support/resistance level has featured in the price action about a dozen times since December 2022.
It will be a bad sign if $386.50 fails to hold up, but so far that doesn’t seem to be the case. LULU stock needs to break above $410 to re-engage bulls. That level stems from a range high back in April 2022. Any break of $386.50 will send Lululemon stock down to $360, where bulls protected the downside twice in August and October 2023.
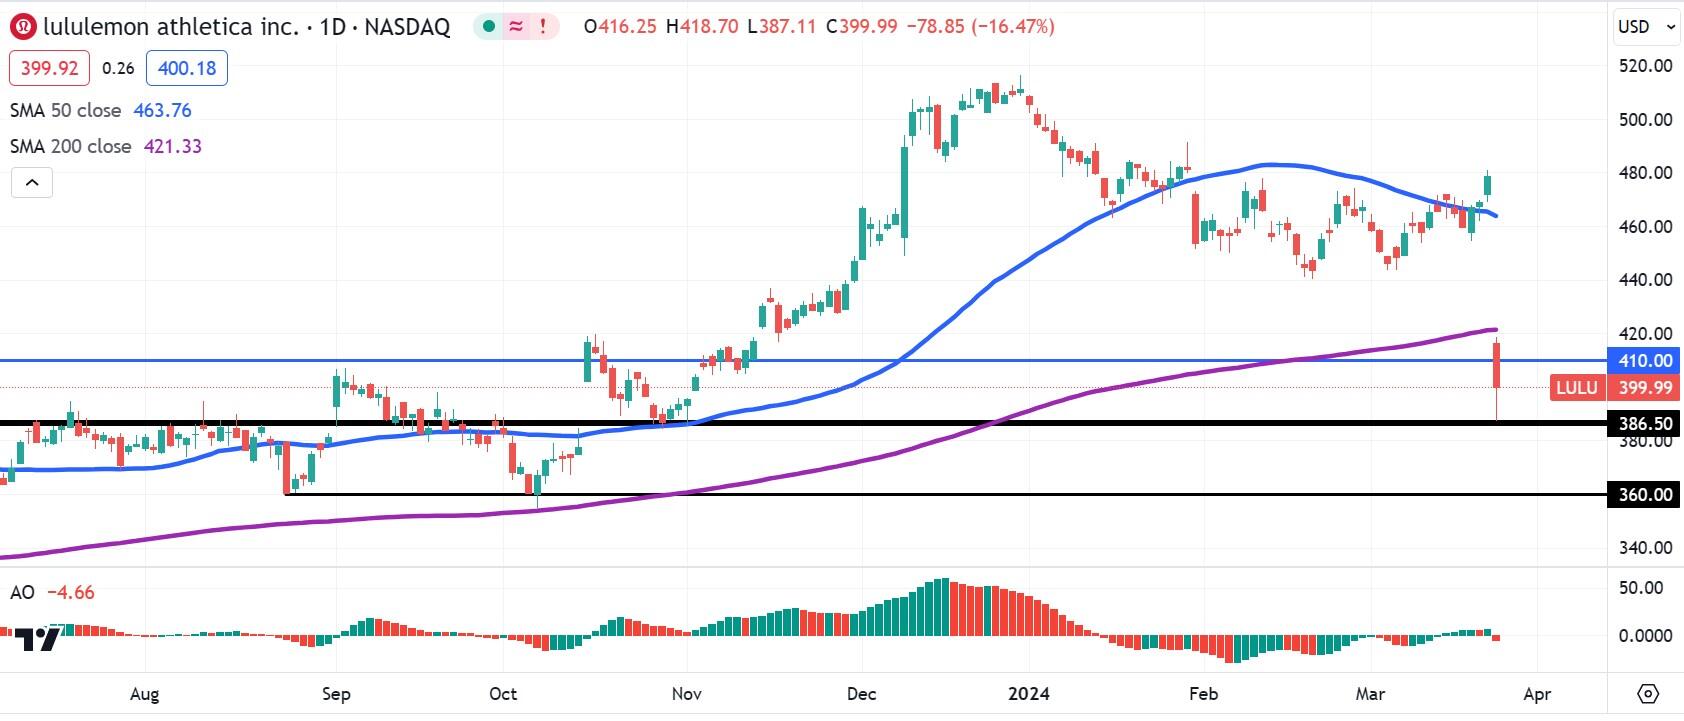
LULU daily stock chart