- USD/JPY shows minimal change, indicating a stable weekly close.
- The weekly chart suggests an upward trend with resistance at Tenkan-Sen (149.53); a break above could target 150.00.
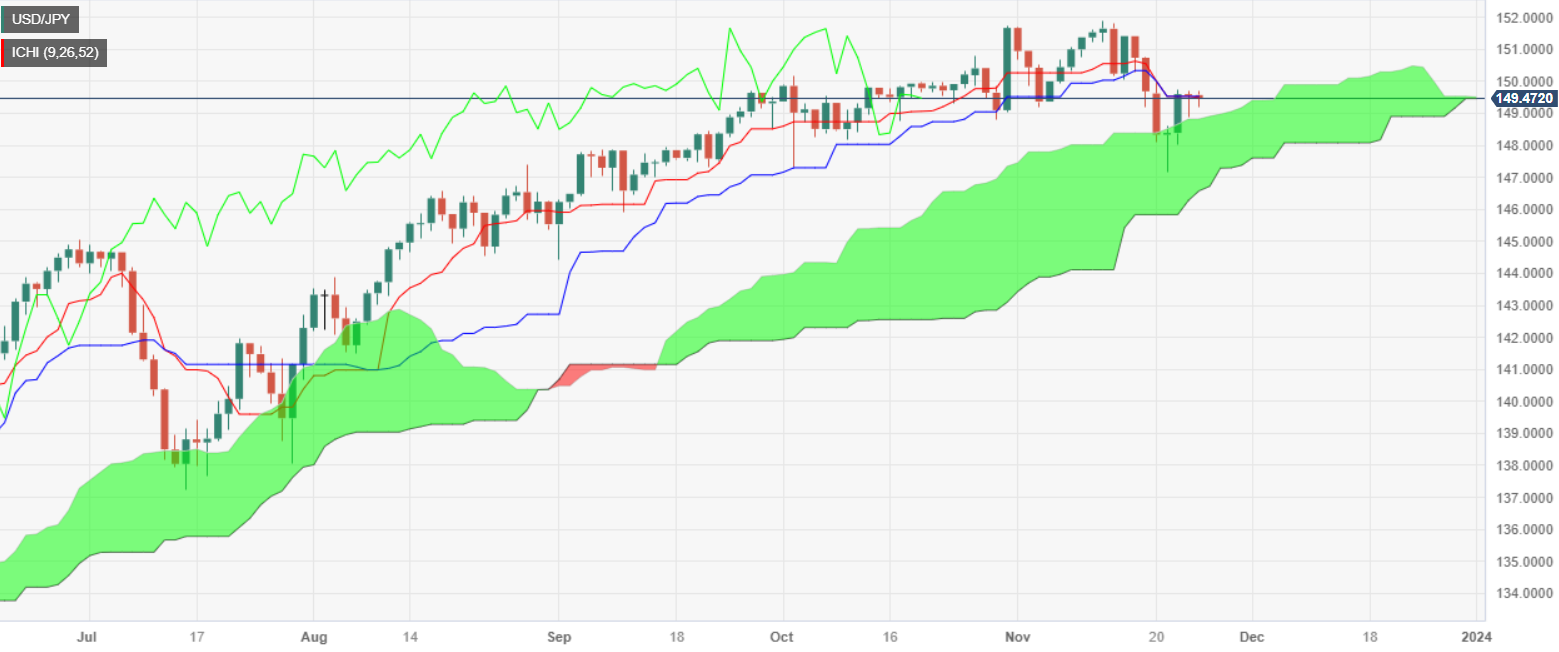
- USD/JPY daily chart key levels to watch include 150.77 and YTD high at 151.91 for upside, 148.01, and 147.15 for downside.
The USD/JPY is almost flat late in the North American session, though set to end the week near today’s opening price and exchange hands at 149.47, printing minuscule losses of 0.02%.
From a weekly chart perspective, the USD/JPY is upward biased, and as the week comes to an end, a ‘dragonfly doji’ is forming, which implies the pair could resume its uptrend. Nevertheless, the major faces solid resistance at the Tenkan-Sen at 149.53. If buyers achieve a weekly close above the latter, the pair could re-test the 150.00 figure.
The USD/JPY daily chart shows back-to-back session posting doji’s, which implies traders are undecided. On the upside, traders will collide with the Tenkan-Sen at 149.47, followed by the 150.00 figure, and the November 17 swing high at 150.77. Once cleared, the next resistance would be the year-to-date (YTD) high of 151.91.
On the flip side, if sellers drag prices below 149.00, that would exacerbate a drop toward the November 21 daily low of 148.01, followed by the latest cycle low at 147.15.