The AUDUSD is down for the 5th consecutive day. Recall on Friday last week, and then on Monday, the price of the AUDUSD was testing/moving above it’s key 100-day MA near 0.6515. The high price reached 0.65224, but ultimately stalled and started a run to the downside, leading to a move from 06522 to the low reached today at 0.6337 (or 185 pips).
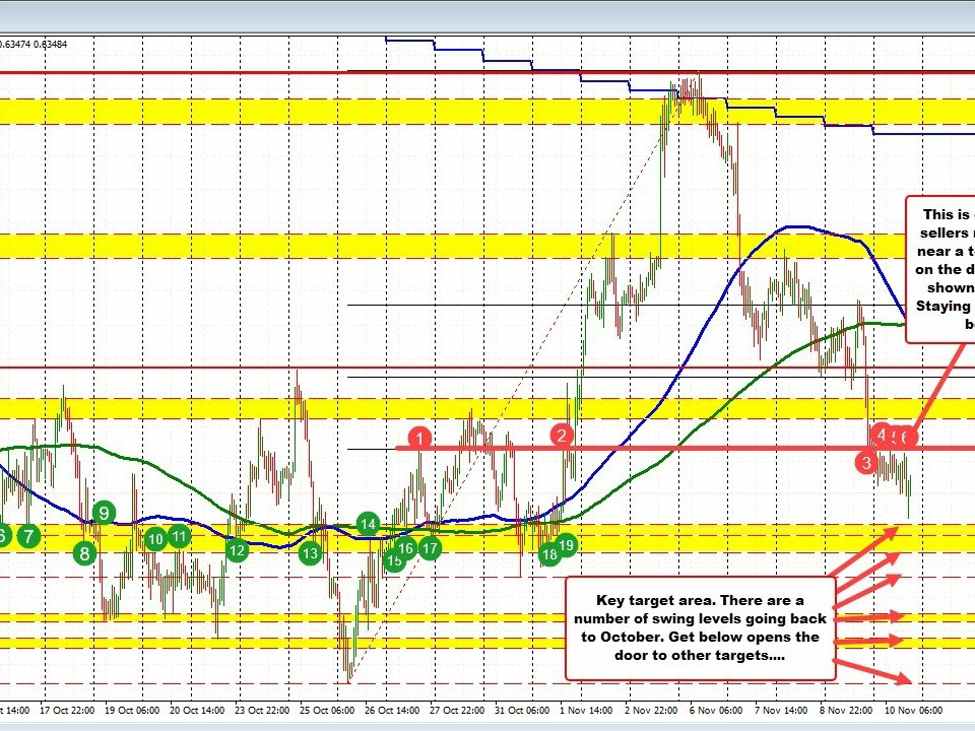
Looking at the daily chart, the fall is taking the price below a swing area between 0.6346 and 0.6363 (see video). Staying below that level is the most bearish for traders. Move above and there could be some rotation back to the upside.
AUDUSD trades to new lows. What next?
Drilling down to the hourly chart above, the 0.6363 resistance level on the daily chart is also close to the the 61.8% retracement of the move up from the October 26 low at 0.6366. The dual levels up to 0.6366 is the short-term risk and bias-defining level now. Staying below keeps the sellers firmly in control. Keep that in mind.
On the downside on the hourly chart, there is a swing area between 0.6323 and 0.6335 to get to and through to increase the bearish bias followed by the swing low from October 31 at 0.63139. Get below those levels and traders will start to look toward the extremes from October between 0.6295 – 98, and below that 0.6284 – 88 with the low price from October at 0.62698 another step target