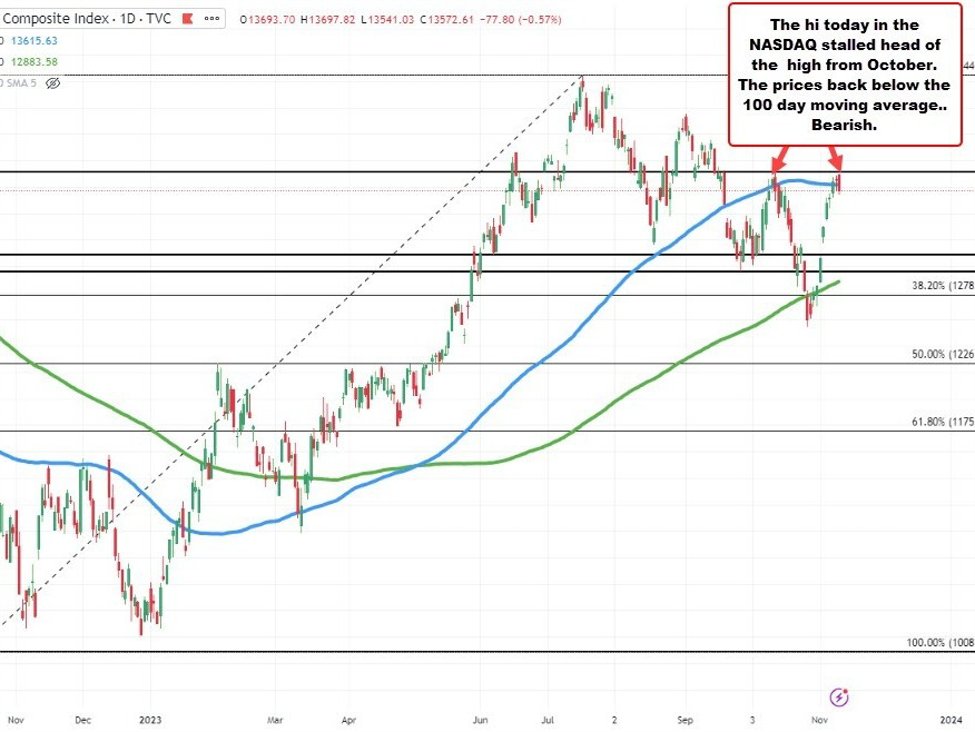
NASDAQ index is a back below its 100 day moving average
The NASDAQ index has moved back below its 100-day moving average at 13615.60. That index moved above its 100-day moving average on Tuesday and closed above it for 2 consecutive days. Those 2 days were one day longer than the October break which had only one close above its 100-day moving average.
The high price today reached 13697.82. The high price going back to October 12 reached 13714.14. The inability to get above that high – and staying above – and the moving back below the 100-day moving average are bearish signals for the index.
Meanwhile, the S&P index reached a high today of 4393.40. That was short of its 100-day moving average at 4402.16. The S&P has not traded above its 100-day moving average since September 20. On September 21 the price gapped below the 100-day moving average and the price has not closed above that moving average since that time