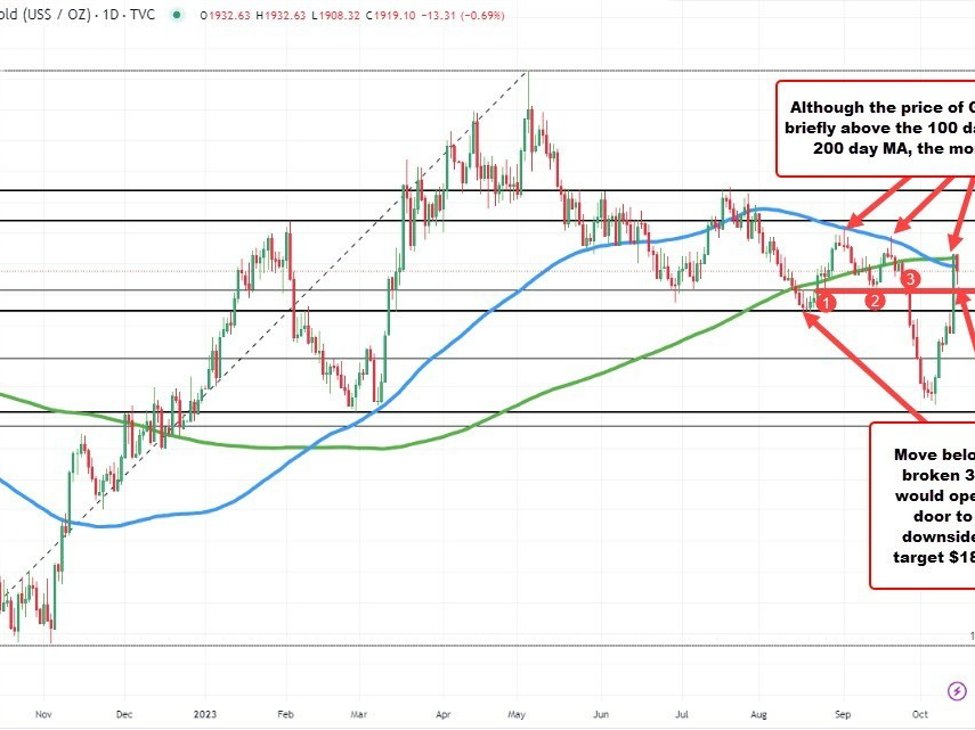
The price of gold surged on Friday due to anticipated geopolitical risks in Israel, reaching a high of $1932.88 and surpassing both the 100 and 200-day moving averages in the process (blue and green lines on the chart above). However, in today’s trading, the price hit a high of $1932.63 but failed to extend further, allowing sellers to push it lower. The current price stands at $1919.42, down -$13 or -0.67%, and is now below the 100-day moving average at $1922.69.
Looking ahead, if the price continues to decline, traders should monitor the broken 38.2% retracement level at $1903.46, a level that previously provided support on August 25 and September 14 before breaking lower on September 26. If the price falls below this level, the next potential support is at $1886.87, which represents the lows from mid-August and near the high from October 12.
A move back above the 100-day moving average and the 200-day moving average would open the door for further upside momentum.
Fundamentally, the 1st barrage at the key daily moving averages did a fairly good job of stalling the rise. However, geopolitical risks from increased tensions in Israel remain and could spike gold through those technical levels. If done I would not fade the move as there could be increased momentum from the technical break in addition to the fundamental story.