GBPJPY tests/breaks below 100 day MA
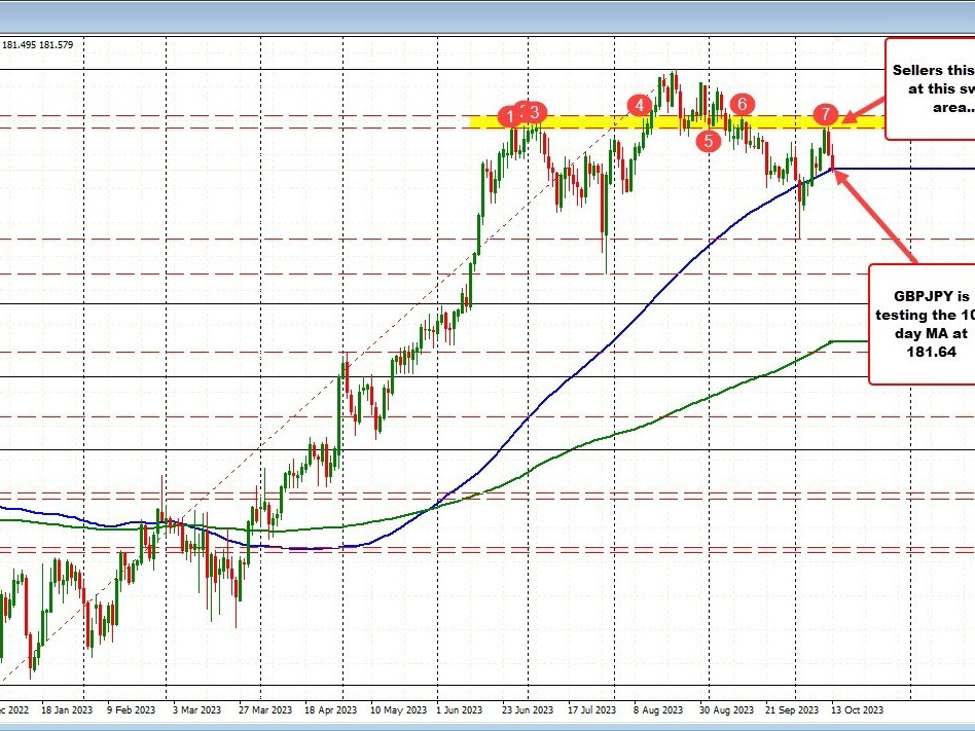
Looking at the daily chart, the 100 day moving average currently comes in at 181.64. The price has just dipped below that level and currently trades at 181.57.
Admittedly, earlier this month, the price fell below the moving average level for the 1st time since March 2023, but could not maintain the bearish bias. Three days later the price was back above the moving average.
Drilling down to the hourly chart below, the price today is also falling back below its 200-hour moving average at 181.837 (a risk level for sellers – stay below is more bearish).
The next downside target would be the 50% midpoint of the move up from the October low. That level comes in at 180.939.
Sellers are trying to make a play technically. Staying below the 100-day moving average at 181.64 and the 200-hour moving average at 181.837 would keep the bias more to the downside. It would take a move above both of those levels to tilt the bias back in favor of the buyers at least in the short term.