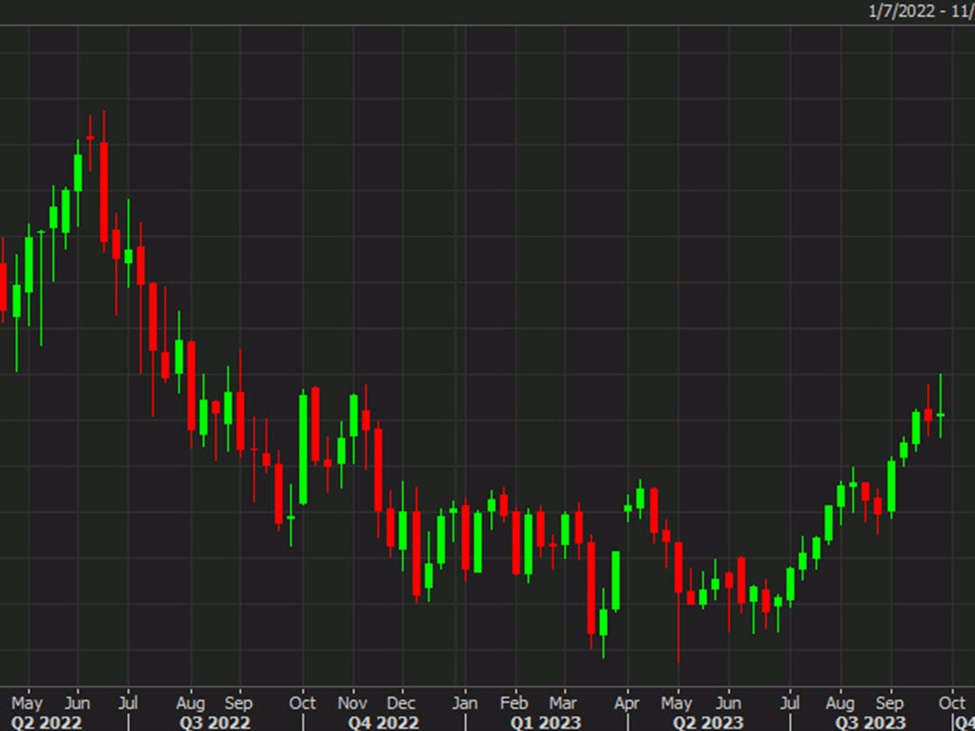
Weekly WTI
Oil is near the lows of the day, down 96-cents but still has some breathing room in what looks like it will be another weekly close above $90.
Still, it feels like something of a loss for the bulls, or at least a loss of momentum. We touched $95 early on Thursday before giving back more than $4 and are on track to finish flat on the week.
That, combined with the early-week selling paints a prominent doji star on the weekly chart. That’s a bit of a red flag about the potential for a reversal and also a sign that volatility will stay high.
I would be more cautious on the downside here for five reasons:
- It’s a new month/quarter on Monday and that could shift allocations. Overall, funds are light on energy, so that could end up being good but a new quarter can change the trend and the trend in Q2 was undoubtedly bullish.
- All OPEC+ risks are to the downside. All it will take is a small hint that OPEC is thinking about pumping more and oil will fall
- Similarly, the 2024 is an election year and the temptation will be for the Biden admin to tap the SPR
- Gasoline cracks are plunging right now. I think that’s more about refineries and them running hotter and changes to winter gas ahead of maintenance but it could reflect demand. Diesel is still rock solid but something is changing in gasoline and any change from the status quo in oil is bearish.
- October, seasonally, is by far the worst month for front month oil
I think that paints a compelling picture for caution.
This article was originally published by Forexlive.com. Read the original article here.