- USD/CAD is trading near the 1.3600 mark, above the key 100-hour EMA.
- Relative Strength Index (RSI) stands in the bearish territory below 50.
- 1.3650 will be the immediate resistance level; 1.3575 acts as an initial support level.
The USD/CAD pair loses traction and hovers around the 1.3600 mark during the early European session on Monday. The weakening of the US Dollar (USD) and the upbeat Canadian employment data dragged the USD/CAD pair lower. The major pair currently trades near 1.3604, losing 0.25% on the day.
According to the four-hour chart, USD/CAD holds above the key 100-hour Exponential Moving Average (EMA), which supports the buyers for the time being. However, the Relative Strength Index (RSI) stands below 50, activating the bearish momentum for the USD/CAD pair for the time being.
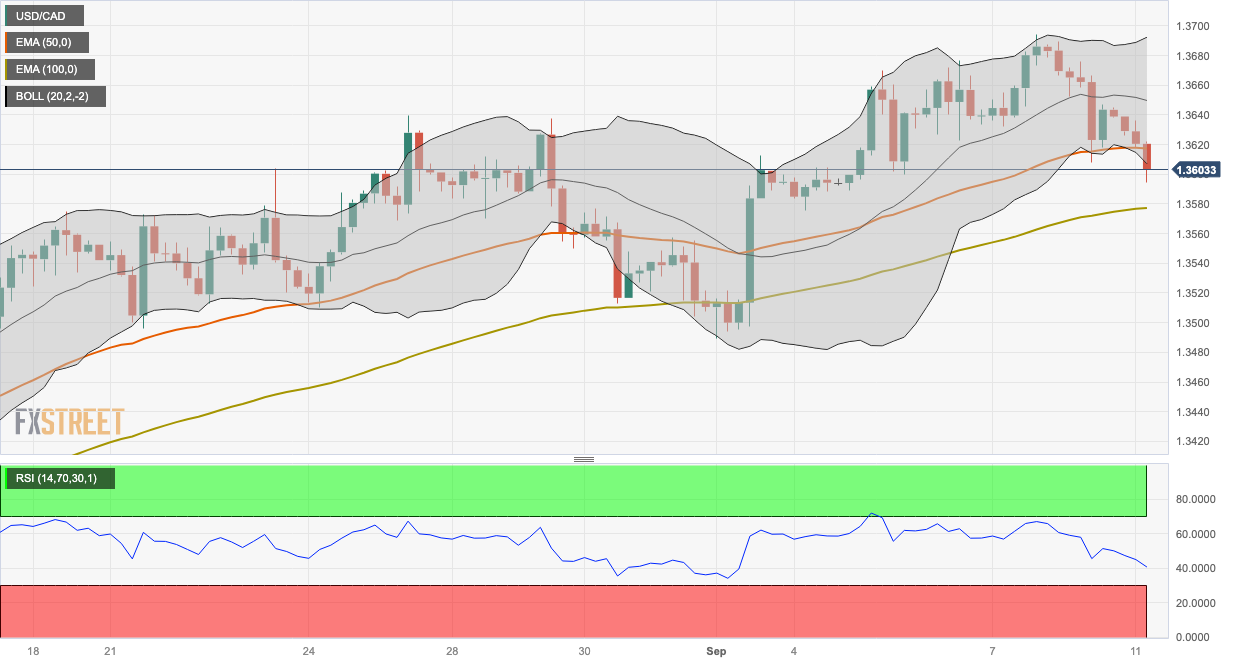
Any follow-through buying above the middle line of the Bollinger Band and a high of May 31 at 1.3650 will pave the way to 1.3670 (a high of September 5). The additional upside filter to watch is 1.3692, representing the upper boundary of the Bollinger Band.
On the flip side, a decisive break below the 1.3600 will see a drop to 1.3575 (100-hour EMA). Further south, the next downside stop is seen at 1.3550 (a low of August 30). The next contention level is located at the 1.3495-1.3500 region, indicating a psychological round mark and a low of September 1.
USD/CAD four-hour chart