The USDCAD has found sellers near the 61.8% retracement of the 2023 trading range. With the USDCAD up each of the trading days today, will the sellers look to lean against the retracement level and start a corrective move to the downside?
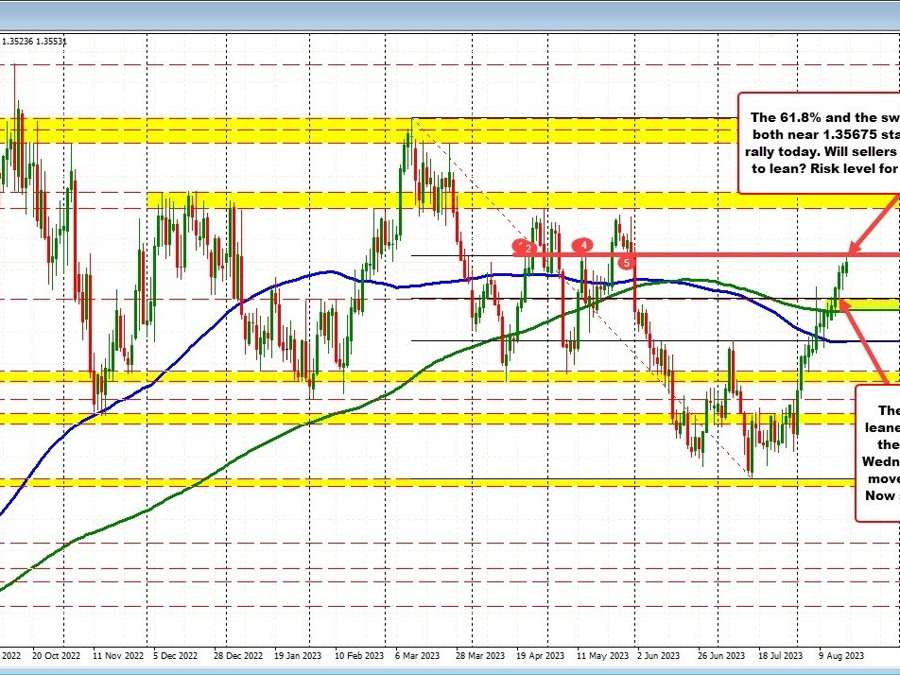
The 61.8% retracement comes in at 1.35674. The high price stalled at 1.3573 before rotating lower. Also near the retracement were swing levels on the daily chart near the same 1.35674 level (see red numbered circles on the daily chart below).
USDCAD on the daily chart
With the retracement target and swing level target reached, traders looking to take profit/play from the short side could start to lean against that level at 1.35674. Staying below is more bearish. Move above and GET OUT.
Having said that, there is work to do on the downside for sellers to prove they can take back control. Looking at the hourly chart below , the 1.3517 – 1.3527 area is a target to get to and through to give sellers more confidence. Below that, and the rising 100-hour moving average comes in at 1.35064.
Of note in August is the USDCAD price remained above its 100-hour moving average apart from parts of two days. Last Friday there was a brief dip below the level but that dip was quickly reversed. Last Thursday, thee price moved and stayed below longer, but could not stay below (see red shaded areas in the chart below) keep.
As a result, getting below the 100-hour moving average is key for sellers going forward (today and into next week’s trading).
USDCAD on the hourly chart