It is Friday, so it is a good time to look back at the price action this week and then look forward to what the price action tells us going forward into the new trading week.
Looking at the GBPUSD on the hourly char this week this weekt above, the price today moved to a new low for the week, and that low bottom near a swing area between 1.2738 and 1.2759. The low price stalled just ahead of the high of that swing area at 1.2762. Support buyers leaned, and have pushed the price higher.
The high prices week was reached yesterday, and that moves all the pair extent briefly above another swing area between 1.2970 and 1.2989. The high price reached 1.29949, just short of the natural resistance at 1.3000.
In between those extremes sets the 50% midpoint of the range from the end of June low to the July high. That level comes in at 1.2866. Also near that midpoint level is the 100-hour moving average and 200-hour moving average. The 100-hour moving average is currently at 1.2870. The 200-hour moving average at 1.28963. The high price today stalled between those levels at 1.2872.
Technically the area between the 50% of the range since the end of June at 1.2866, and the 200-hour moving average (at 1.28963) today – and going forward – will be the barometer for buyers and sellers.
- Move above the 200-hour moving averages more bullish.
- Stay below and move below the 50% midpoint level tilts the bias more to the downside.
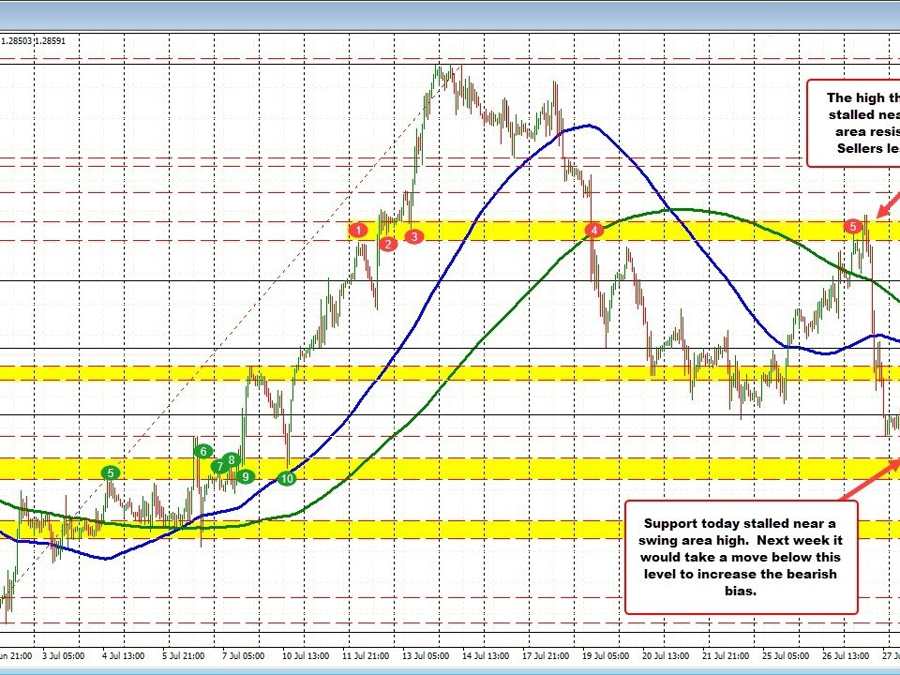
Taking a broader look at the daily chart below, the low price this week stalled near the 61.8% retracement of the longer-term move down from the end of May 2021 hi to the low price reached in 2022. That level comes in at 1.27605. The low price they reached 1.2762.
Looking at the high for this week, the high price stalled at 1.29945. That was near the high of a swing area going back to March and April 2022 between 1.29496 and 1.29987.
Combining those support and resistance levels on the daily chart with the support and resistance levels on the hourly chart suggest that the range this week from high to low is key. It will also remain key and important for traders going forward into the new trading week (And beyond).
Ultimately a break above the 1.29987 level (let’s call 1.3000) or a break below the 1.27605 will open the door for more momentum to the upside more moments into the downside.
For the time period, however, the pair is in neutral territory as defined by the hourly technicals. Traders will be watching the moving averages on that chart for bias clues.