The USDCAD traded in a relatively narrow trading range this week with the price reaching the week’s high on Tuesday. That move took the price above the 200-hour moving average of 50% retracement of the July trading range. However, momentum faded quickly and the price then rotated lower over the next 2 days to the Thursday low.
The initial jobless claims data yesterday and strong dollar buying saw the USDCAD pair rebound back to the 200-hour moving average. The price backed off into the close and moved lower in the Asian session today. Another test of the moving average in the European session kept the lid on the pair.
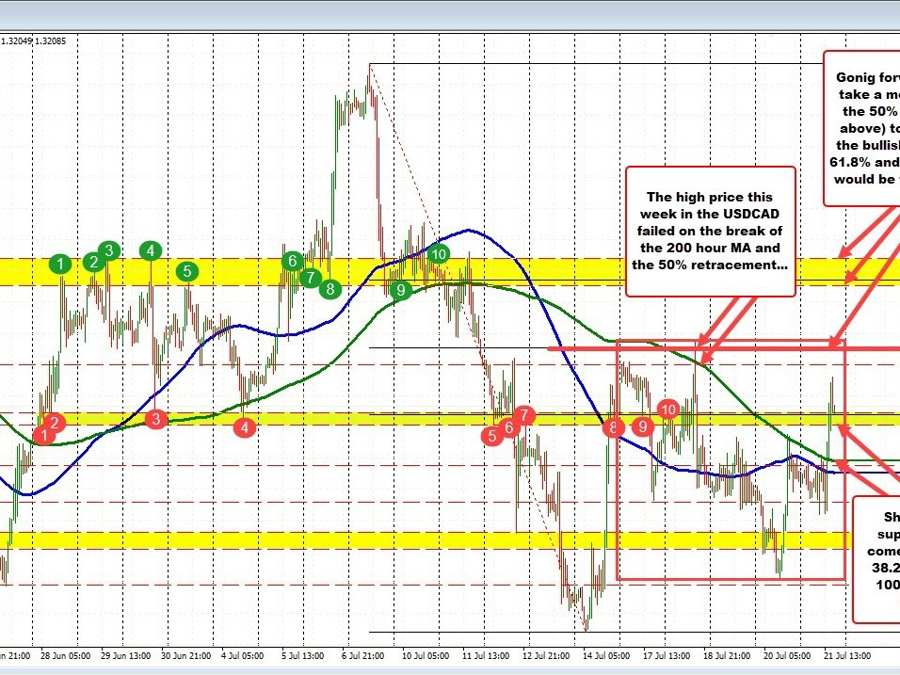
However, the US session today has now seen a rotation back above the 200-hour moving average and also above a swing area and 38.2% retracement near 1.3204 (see red numbered circles on the chart below).
What next as we head into the close of the week and into the new trading week?
Move below the 38.2% retracement and traders will look toward the 200 and 100-hour moving averages.
Conversely, bounce off the 38.2% retracement, and traders will once again target the 50% retracement level. Move above that level and a higher swing area near the 61.8% retracement at 1.32737 would be targeted
USDCAD range traded this week. What next?