The USDCHF broke sharply to the downside this week following the dollar’s move lower on the back of lower CPI and PPI. The prices of imports also came in lower with the YoY now down -6.1%. That sent yields lower and it pressured the USDCHF as well.
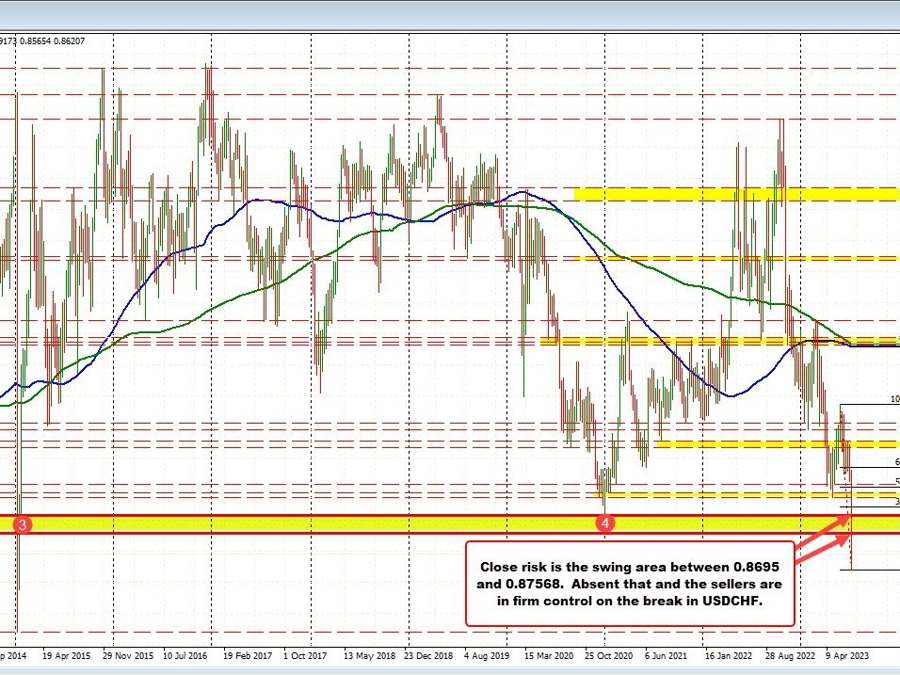
Technically, the price fell below January 2021 at 0.87568. It would ultimately take a move above that level to hurt the sellers looking for more downside momentum on the major break. Ahead of that the 2014 lows near 0.86959 may be a closer target that if broken would give a short-term tilt in the favor of the buyers.
Drilling to the hourly chart below, the yellow area represents the swing levels off of the daily chart from 2014 and 2021’s. In between sets the falling 100-hour moving average which currently comes at 0.87102. That moving average will likely be the 1st target resistance to get above if the buyers are to take control (it is moving down at a fairly rapid clip).
Ultimately if the price of the USDCHF gets above the 100-hour moving average, it is just step one in the rebuilding of any sort of buyer’s control.
- The low from 2014 at 0.86959,
- The 38.2% retracement of the move down from the July 6 high at 0.87304, and
- The 2014 low at 0.87568
Are ALL targets that would need to be broken to give the buyers more control, and also start to worry the sellers.
USDCHF on the hourly chart
The current price at 0.8618 is still a bit always from those levels.