The USDCAD spiked higher after the weaker-than-expected jobs report this morning. The price which tested its low from early May at 1.33132 in the late European session (the low reached 1.33157), moved up to a high of 1.33688. That high tested the Asian session high at 1.33705.
Sellers leaned ahead of that high, and the price has since rotated all the way back down to retest – and even make a new low for the day – at 1.33156. Once again the low from May is at 1.33132. The price is bouncing and currently trades at 1.33262.
So since the jobs report at 8:30 AM was released, on the topside, the USDCAD highs from the Asian session were tested and found sellers, AND the lows from the European session (and the low from May) were tested and found buyers (for now).he
The battle is on.
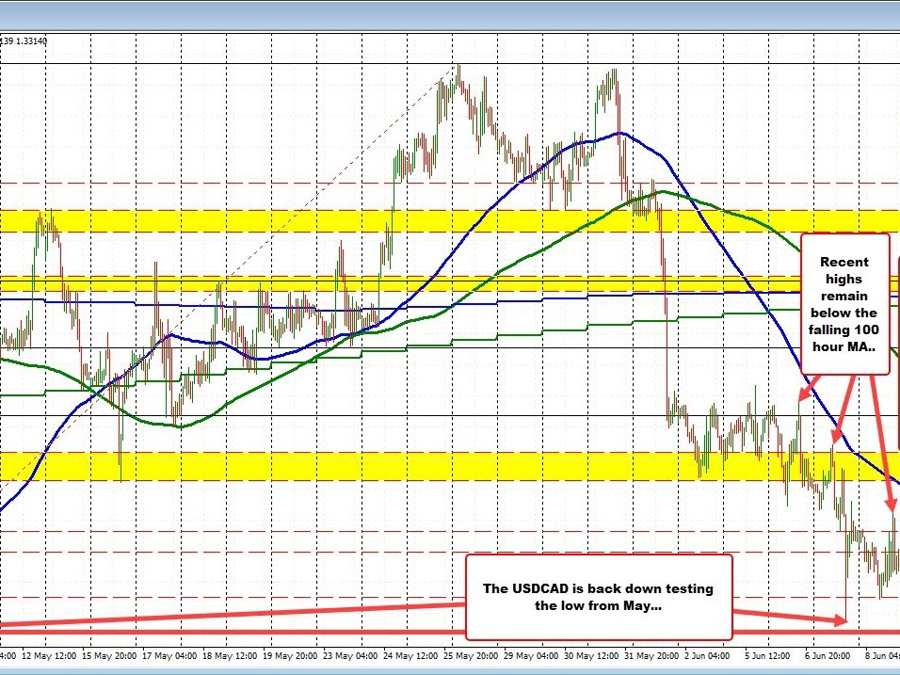
Taking a broader view at the price action, this week has seen the price of the USDCAD step down with lower highs over the last 4 trading days. The price has also been able to stay comfortably below the falling 100-hour moving average (blue line in the chart above). That level currently comes in at 1.33866.
Fundamentally, the Bank of Canada did surprise with a hike of 25 basis points on Wednesday ending their conditional pause which kept rates steady for 2 consecutive meetings.. That hike sent the USDCAD price down (higher CAD) to a low of 1.33199. However, the price did rebound off of that initial downward reaction.
The bounce gave buyers a shot to probe higher. They did, but was still not being able to get above the 100-hour moving average. That failure was an important technical “tell”, that will continue going forward. Until the price can get above the 100-hour moving average, the sellers are still more in control.
Take a broader look at the daily chart below, the May and April lows along with other swing levels going back in time targets 1.3296 – 1.33203. Getting below that area would have traders targeting the February low at 1.32613 and below that, another swing area between 1.3207 and 1.32299 (see daily chart below).