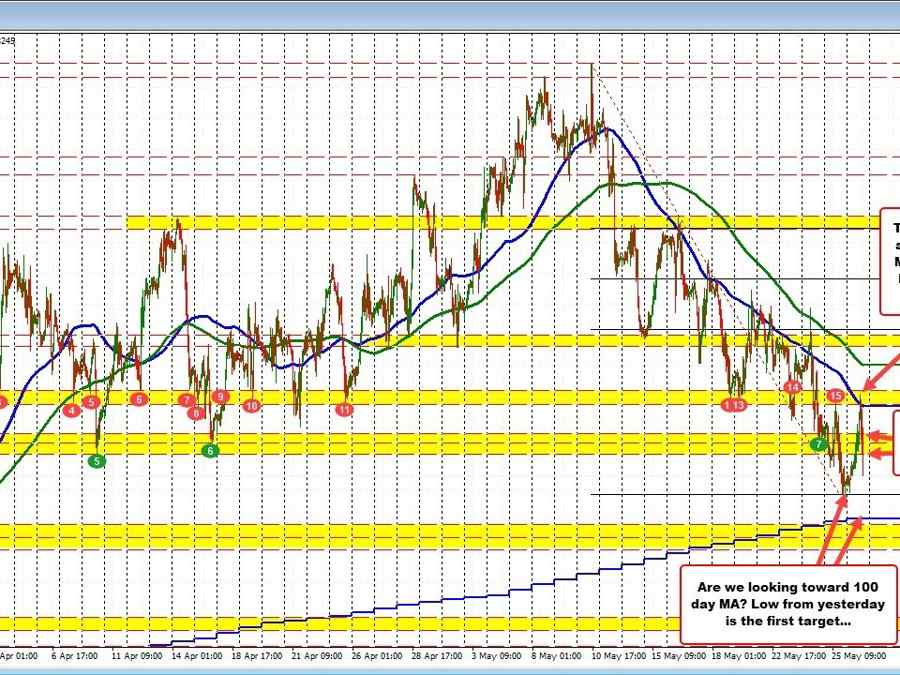
The GBPUSD moved higher in trading today held by better-than-expected retail sales. The price extended up to and through the falling 100-hour moving average currently at 1.23839 (blue line in the chart above). The price also entered into a swing area that has a number of different swing lows and swing highs going back to the end of March (see red numbered circles). The momentum could not take the price above that swing area near 1.23974. The price rotated back to the downside. The better US data reversed the price even more as focus returned to the stronger US data (and higher inflation).
The pair is now moving below a lower swing area between 1.2343 and 1.2360. Staying below that level now would keep the sellers firmly in control (close risk for sellers now).
The next target comes against the lows from yesterday and earlier today near 1.2308. Below that, and get below 1.2300, and traders will look toward the 100-day moving average of 1.22871 (blue step line on the chart above). It seems traders might be focused on that key target especially as the Fed becomes more in play (once again) for either a June or July hike.
For a video explaining the bias click below. It is a great way to learn.