Gold is currently experiencing a downward trend, influenced by a strengthening dollar and climbing yields. Notably, the two-year yield has increased by 2.3 basis points to 4.305%, while the 10-year yield rose by 0.5 basis points to 3.7015%. Concurrently, the US dollar index shows a 0.31% increase for the day.
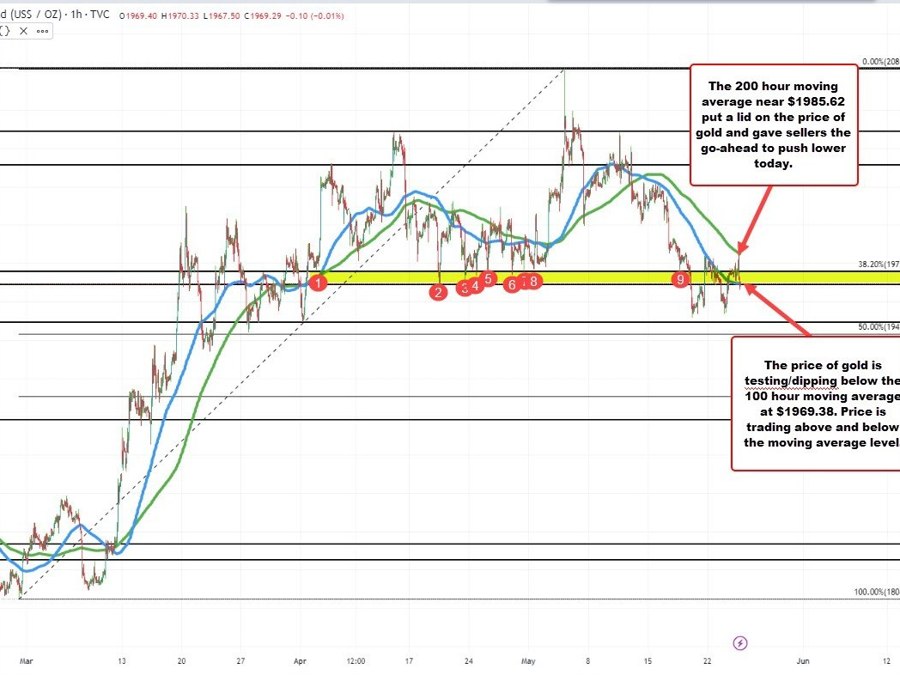
Observing the hourly chart, gold peaked at $1985.27 today, testing its 200-hour moving average, which was at $1985.62 at that time (but has since dropped slightly to $1984.87 – see green line in the chart above). The failure to exceed this average prompted sellers to drive the price down, aided by the bolstered dollar and yields.
Most recently, gold’s price has slipped below the 100-hour moving average at $1969.36 and a swing area ranging from $1968.80 to $1975.70. Potential downward targets are the previous lows from last Thursday and yesterday, pegged at $1951.50, as well as the 50% midpoint of the upward trend from March, situated at $1943.05.
Technically, to restore a bullish outlook, gold needs to surpass $1975.75 (the 38.2% retracement of the upward move) and the 200-hour moving average, which currently stands at $1984.88. Absent that and the sellers are still more in control.