As the debt talks continue to muddle along, and traders getting wary of overbought conditions, the broader S&P and NASDAQ index has been moved to new session lows for the day.
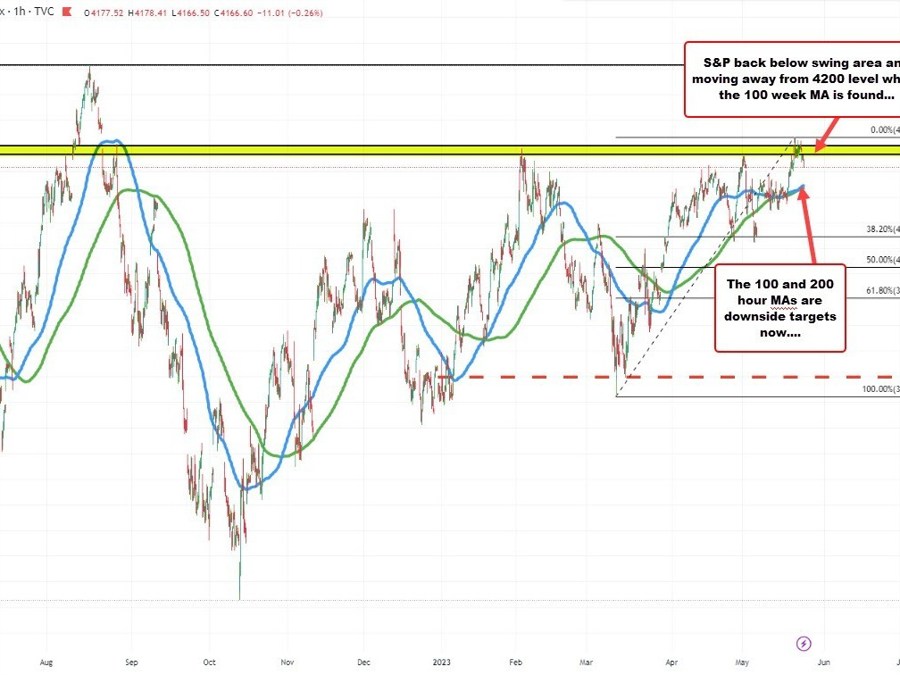
For the S&P, it reached a recent high of 4212.91. That took the price above the key natural target at 4200. The 100-week moving average is also right at that level increasing that level’s important from a technical perspective. Buyers had their shot. You only get so much time to show you “mean it”. Time is running out, and the price is dipping. The 100 and 200-hour moving averages come in at 4133.63 and 4137.48 respectively. Those levels will be downside targets now on increased selling momentum.
For the Nasdaq index, the index remains a good distance away from its rising 100-hour moving average at 12355.46. However, it did move back below a swing high going back to August 2022 which was part of a gap. That level comes in at 12655.84. Overbought worries also give traders some cause for pause.
Stay below 12655.84 keeps the sellers in control in the short term. Move above and there may be some disappointment. The 100 hour moving average at 12356.46 and moving higher will be eyed as a support target going forward.
Some of the high flyers are doing worse than the market:
- Nvidia is down -1.21%
- Alphabet is down -1.14%
- Microsoft is down -1.14%
- Apple is down -1.29%
The NASDAQ index is down -0.75% and the S&P index is down -0.60%.
Bucking the trend:
- Meta is up 0.64%
- Amazon is up 0.82%
- Adobe is down but only by -0.40%
- The regional bank KRE ETF is up 2.25%