Today is quarter end. The USD is ending the quarter mixed with declines vs the EUR , GBP , CHF and CAD and gains vs the JPY, AUD and NZD. Below is a technical summary of the major pairs in what was an up and down quarter for all of the pairs. I also outline the technical levels in play to start the new month/quarter. The levels will be the roadmap for the journey ahead.
———————————————————————————————————————————————————-
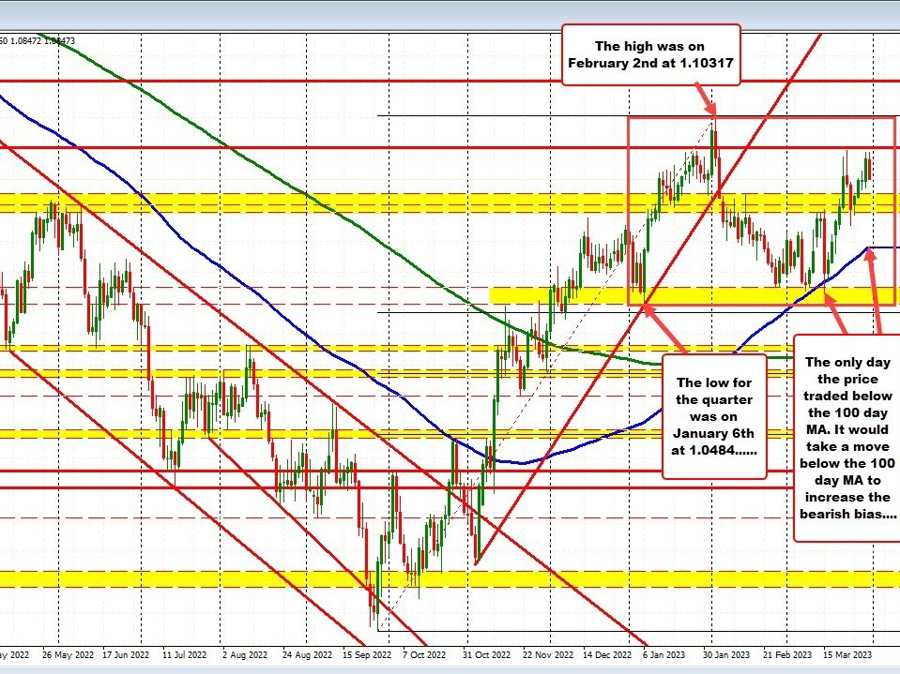
EURUSD: Up 152 pips or 1.426%
The EURUSD moved up 152 pips at 1.0851 from the end of year level. That is up 1.426% for the year. The low for the quarter was at 1.0481 on January 6.. The high reached 1.10317 on February 2. The low to high range for the month was 547 pips.
The general price action saw the pair move higher in January, lower in February, and back higher in March. The price dipped below the rising 100 day MA on 1 day in the quarter (on March 16) but had no closes below that MA level during the entire 1Q (see blue line on the chart above). The 100 day MA is at 1.06479 heading into the new quarter. It would take a move below the level MA to tilt the bias more to the downside.
ON the topside getting above 1.0940 and then the high for the quarter at 1.10317 would increase the bullish bias.
———————————————————————————————————————————————————-
USDJPY: Up 162 pips or 1.25%
The USDJPY is up 162 pips from the end of 2022 level at 131.10 or 1.25%. At the quarter high reached on March 8th, the pair was up 681 pips. At the January 16 low, the pair was down -388 pips. The low to high trading range was 1070 pips which is the most narrow since 3Q of 2021.
Technically, the run higher was able to extend above the 100 day MA (blue line) and close above that MA line for 2 trading days. The 200 day MA was breached intraday on one day, but did not close above the 200 day MA during the entire quarter. The high price today got within 25 pips of the falling 100 day MA at 132.936. The high today was the closest the price has been to the 100 day MA since March 9th. It will take a move above the 100 day MA in the new trading month, to increase the bullish bias for the pair. Until then, the sellers remain in control.
———————————————————————————————————————————————————-
GBPUSD: Up 247 pips or 2.04%
The GBPUSD reached a low on January 6th at 1.18408 and did not return to that level until March 7 to March 9 when a new first-quarter low was reached at 1.1802 on March 8. The price has since moved up to near the high with a peak today at 1.2422. That got with 23 pips of the high from January 23rd at 1.2445.
The high in January got within 2 pips of the December high at 1.2447 making a double top at that level. Heading into the new trading month, that ceiling will be the key upside target to get to and through.
On the downside, the GBPUSD has the rising 100 day MA at 1.21266. The price moved below the 100 and 200 day MAs in March on the way to the March 7 low, but there were only 4 closes below the 100 day MA in the quarter, and only 2 closes below the 200 day MA which is near the lows at 1.1853.
For the quarter the pair is trading up 247 pips or 2.04%. The low to high trading range was only 645 pips. That was the lowest range since the 2Q of 2021.
———————————————————————————————————————————————————-
USDCHF: Down -92 pips or -1.00%
The USDCHF traded down, up and down in the 1Q of 2023. From the closing level at 0.92244, the price moved to a low in early February at 0.90586. On March 2, the high reached 0.94404 which was retested on March 8th when the price reached 0.94387 before tumbling to a low of 0.90706, with 12 pips of the early February low. Another snap back rally and fall into month/quarter end reached 0.91152 today before bouncing to 0.9146 near the close.
The total low to high trading range for the quarter is only 381 pips which was the lowest trading range since Q1 2022. The pair is trading down -92 pips from the end of 2022 level or – 1.00%.
Technically, the highs skimmed the falling 100 day MA (blue line). There was only 1 day (March 8th) when the price moved above the 100 day MA, but there were NO closes above the 100 day MA. The 100 day MA is up at 0.92965. The price would have to move above that falling MA, and stay above, to increase the bullish bias for the pair. On the downside, the 0.90586 to 0.9101 are home to a number
———————————————————————————————————————————————————-
USDCAD: -26 pips or -0.19%.
The USDCAD is ending the quarter down just 26 pips from the end of year level of 1.35415 or -0.19%. The initial move this quarter was down to the low for the quarter reached in early February at 1.3261. The snap back rally took the price to the high which was reached on March 10 at 1.38614. The low to high trading range was an even 600 pips in total. That was the lowest low to high trading range since the 1Q of 2022 when the range was 471 pips.
Technically, the price spent near equal time above and below the 100 day MA. It is therefore apropos that the pair tested the 100 day MA both yesterday and today at 1.35159. The price is closing today right at the MA level. The new month and quarter will use that MA as the bullish/bearish barometer. Move below and traders will look toward the rising 200 day MA which is at 1.33691. The price has not traded below the 200 day MA since August 11, 2022, and not had a closing daily bar below the MA since June 8, 2022.
If the price does move higher, traders will need to get above the 50% midpoint of the 1Q at 1.35614 and then the swing high from January at 1.36849. There is a swing area between 1.3807 up to 1.38614 which has a number of swing highs going back to September 2022 (see red numbered circles).
———————————————————————————————————————————————————-
AUDUSD: -131 pips or -1.99%
The AUDUSD closed 2022 at 0.68146 and is closing the quarter at 0.6683. That is down -131 pips on the quarter or -1.99%. The low to high trading range took the price to a high on February 2nd at 0.7157. The low was reached at 0.6564 on March 10. The total high to low trading range was 593 pips.
Technically, the high price for the quarter stalled after taking out the high from August 2022 at 0.71357 to a high of 0.7157 on February 2nd. That break could not be sustained on the day of the break, and the move to the lows for the quarter was started.
That move too 26 days to fall 593 pips before rebounding back toward the falling 200 day MA (green line) currently at 0.67517. Sellers leaned ahead of the 200 day MA on both March 22 and March 23. The high on the last day of the quarter reached 0.67373, just 14 pips from the 200 day MA, before rotating back lower and closing near 0.6683. The lows over the last 3 trading days of the quarter stalled near the 50% midpoint of the rand since the October 2022 low at 0.6663.
What next?
The 200 day MA will be the close barometer on the topside. Move above and some of the bearish bias is replaced with a more bullish bias. Above the 200 day MA will have traders targeting the higher 100 day MA at 0.67984. A move above that would open the bullish door more.
On the downside, a move below the 50% midpoint, would increase the bearish bias and have traders looking toward the lows and lower swing area between 0.65468 and 0. 65847 (see green numbered circles).
———————————————————————————————————————————————————-
NZDUSD: -96 pips or -1.50%
The NZDUSD closed the year at 0.6348. The price is settling on the last day of the quarter at 0.6252. The price moved down 96 pips or -1.50%. The high for the quarter was reached on February 2 at 0.65375. The low was reached on March 8 at 0.6084. The high to low trading range was 451 pips, which was the lowest range for a quarter since Q3 2021.
Technically, both the high extreme for the quarter and the low extreme stalled near swing areas. On the topside the area between 0.6529 and 0.6578 stalled the rally (see red numbered circles). On the downside, the swing area between 0.60559 and 0.60844 stalled the fall (see green numbered circles).
The up and down price action for the quarter started to flatten both the 100 and 200 day MAs (blue and green lines on the chart above). The 100 day MA also moved above the 200 day MA. The 100 day MA is ending the quarter at 0.62925. The 200 day MA is at 0.61453. The closing price is closer to the higher 100 day MA at 0.62527 after the high price for the day tested the upper MA level on Friday.
Over the last 15 trading days, the price closed between the two daily MAs on 14 of the days (there was a close above the 100 day MA on March 17, but that break failed the next day).
Going into the new trading month/quarter, the two MAs will be the bullish above, and bearish below barometers. Get above the 100 day MA at 0.6292 and stay above is more bullish. Move below the 200 day MA at 0.6151 is more bearish.