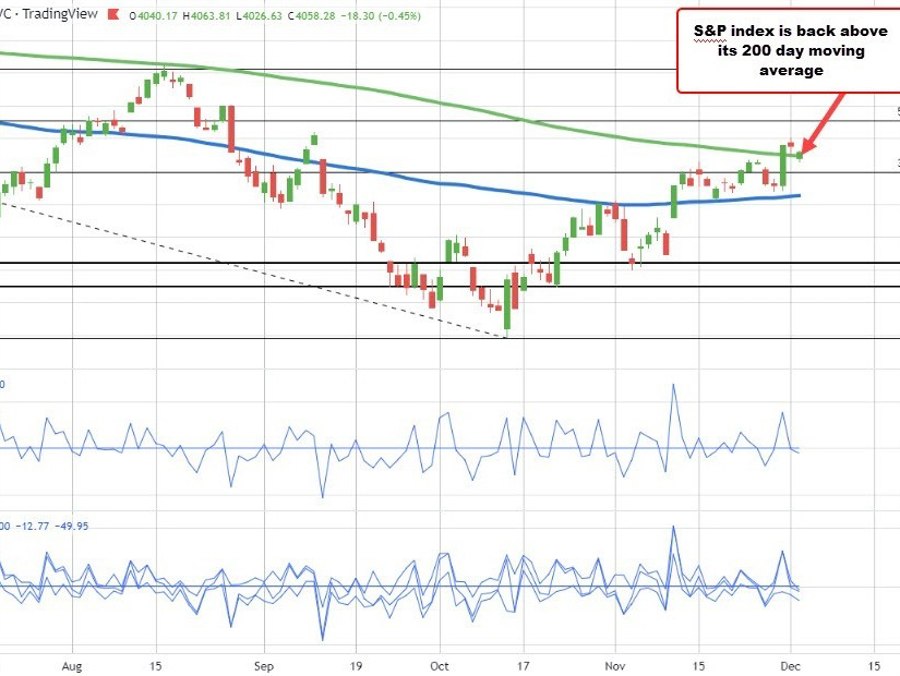
The US stocks are recovering from their initial declines on the back of the stronger US jobs report. The S&P index is currently trading down -18.30 points or -0.45% at 4058.28. The low price reached 4026.63 (-49.95 points). The high price is up at 4063.81 (-12.77 points).
The move back to the upside has taken the price back above its 200 day moving average at 4046.23 (green line in the chart above). On Wednesday the price closed above that moving average for the first time since April 2022. Yesterday the index closed above the moving average level as well. Closing the week above the 200 day moving average would be a bullish result for the index. The moving average will be the barometer for buyers and sellers. Stay above is more bullish. Move below is more bearish.
For the NASDAQ index, it is down -83 points or -0.73% 11398.46. It’s a low took the price down -185.73 points. It’s high, the index was down -56.16 points today.
The Dow industrial average is down -69 points or -0.20% at 34326.83. At the index is low, the price was down -355.29 points. Edit session high, the price was down -29.16 points. Buyers
Although major indices are lower, the rebounds are still impressive in seem to suggest the buyers are not giving up just yet.
For the trading week, the
- Dow industrial average is unchanged
- S&P index is up +0.87%
- NASDAQ index is up 1.6%