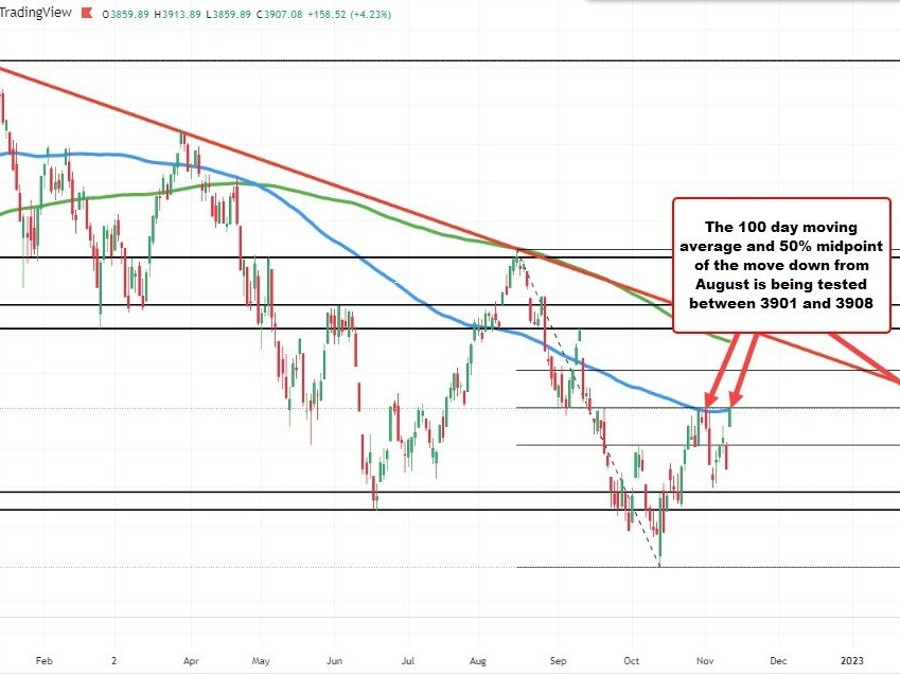
The S&P index traded to a new session high 3913.89. The current price is trading at 160 points or 4.27% at 3908.58.
The move higher has now taken the price above the 100 day moving average at 3901.83. The 50% retracement of the move down from the August high comes in at 3908.43.
On October 28, and November 1, the price moved above the 100 day moving average, but backed off. This is a key area from a technical perspective.
Get above and it opens the door for a move toward a 4000 level and the falling 200 day moving average at 4082.48. The August high stalled near the 200 day moving average near 4325.28 and rotated down to low price of the year at 3491.58.
This article was originally published by Forexlive.com. Read the original article here.