The USDJPY is not letting up. The pair is trading to a new high going back to 1990. The high just reached 148.95. The tries to the downside today could not get very far.
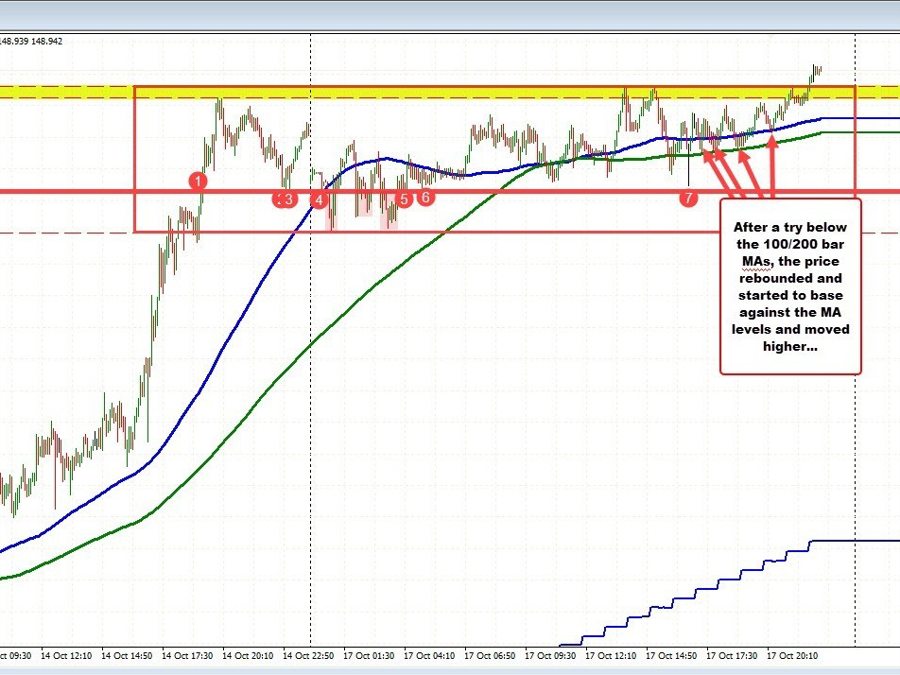
Looking at the 5 minute chart, the pair moved below the intraday 100/200 bar MAs on a number of occasions, but the momentum could not keep the pair below those MA level. The traders started to use the MAs as support. The 100 bar MA comes in at 148.78. The 200 bar MA comes in at 148.735.
Going forward, the closest risk defining levels remain at those intraday MA levels on the above chart. Absent a move below those MA levels, and the buyers are in control.
Moving below does not necessarily tell us that the top is in, but it does give the sellers a victory.. However, the traders would then have to keep the pair below the MA levels to work on the lower levels which include 148.55 and then 148.40. Move below those levels, and traders can start to think about potential for a more meaningful correction. Absent that, and the buyers are still in firm control. The sellers are losing.