The GBP is the runaway strongest of the major currencies with gains of 1.02% vs the EUR and up to 2.51% vs the CAD.
The GBPUSD trading range is 347 pip vs the 22 day average of 182 pips (around a month of trading). The GBPUSD is up 1.56% today .The GBPUSD has moved up to the 200 hour MA at 1.10424 (the low for the day was at 1.0761). The price is also moved above the 50% retracement of the move down from the September 13 high at 1.10452 and above a downward sloping trendline on the hourly chart near the same levels. Traders are sitting on the fence with the lean to the upside.
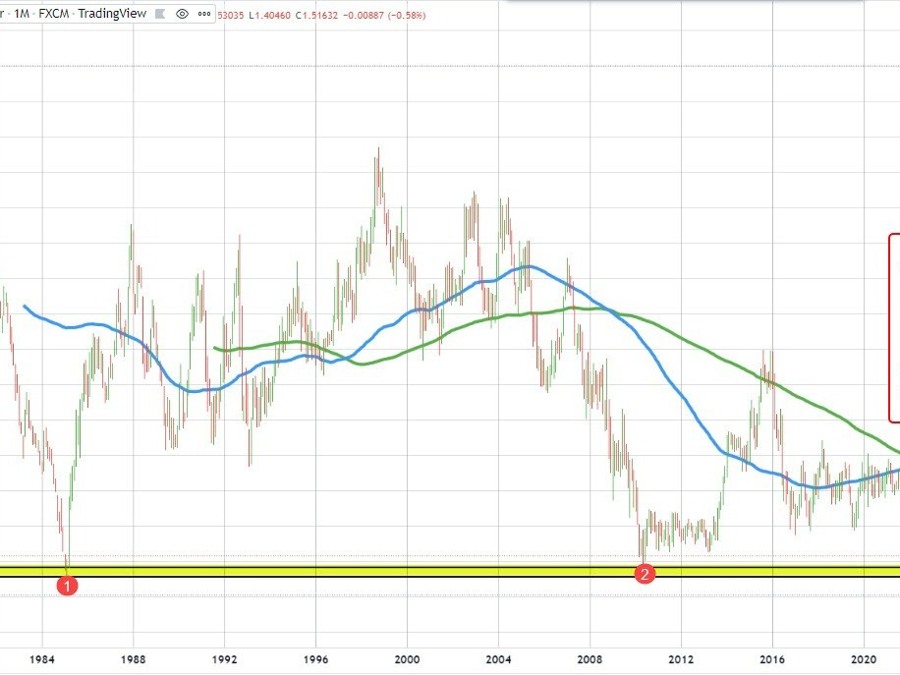
How about the GBPCAD, the biggest mover of the day?
Looking at its monthly chart of the GBPCAD, like the GBPUSD, the tumble on Monday took the price below the 1985 lows and to the lowest level on record. Looking at the monthly chart, the 2010 low came in at 1.48304. That was broken. The 1985 low was at 1.4559 and that was also broken. So moving to 1.40672 was pretty significant break.
However the price has now retraced back above those levels with the pair currently trading at 1.51606.
Drilling to the daily chart, the price decline on Monday fell below a lower trendline which helped to accelerate decline. The bounce back rally took the price back above the trendline on Tuesday and Wednesday, with price action above and below the line. Today, buyers leaned against the old trendline pushing the price higher, and the pair now looks toward a downward sloping topside trend line near 1.53027.
Drilling further to the hourly chart, the pair between August 29 and September 23 traded between 1.50184 and 1.53027. On Friday last week, the price moved outside of that range and continue the tumble on Monday. Since then the price is a snapback within the trading range helped by the sharp move higher today.
Looking at the price action, the Asian session lows did move back below the falling 100 hour moving average (blue line), but then reversed and shot to the upside extending back above its 200 hour moving average at 1.4949 followed by the floor of the up and down area at 1.50184. With the current price trading at 1.5159, it is in the middle of the consolidation trading range. The traders are taking a breather.
What next?
Flip a coin with the price in the middle of the old trading range on the hourly chart, but look for the 1.5018 level to hold support. I would also expect that sellers would lean against the 1.5300 level.