This is my extracted commentary from this mornings technical video. If you want to learn about analyzing the market price action, I think it has some lessons. I will explain more below. Take a look at the video first.
Lesson 1. Know what the bias is.
Yes.. the price moved higher today, but overall, the dollar is king and what that means is the GBPUSD buyers need to show they can take control. From the standing start today, the hourly chart was my focus and the price is higher, BUT as outlined, the price is still below the 50% of the trend move down from the high on Thursday. I chose that high becaue on that day the price tested the 100 hour MA and found sellers against that level. Sellers were in control and they pushed the price lower.
The 50% is a key hurdle in determining bias for me. Yes, the price moved above the 50% on Monday, but closed back below the level. In trading today, the price moved back toward it, but could not reach it. The 50% was also near the close from last week. I thought enough of that level to talk about it as well. Being below each is still a bearish bias. The price is also below other levels including the falling trend line and the 100 hour MA. I comment that ultimately if the buyers are to take more control, those are also upside targets to get to and through.
Lesson 2: Drill down. See if the market is giving any other clues technically from a shorter term price and technical perspective.
From the hourly chart, in the video I choose to drill down to the 5 minute chart for bais clues. Why? If you are looking for a change in the bias, the shorter term chart often is where short term traders will start to lean and shift. Traders need clues from the price action NOW and that bias needs to stay in the favor of the counter trend..
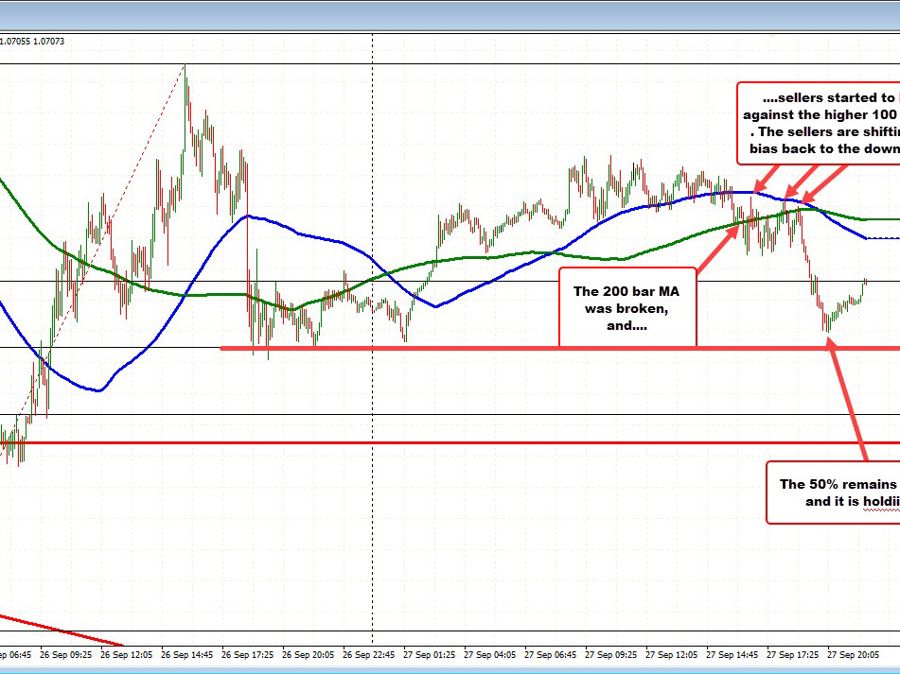
So looking at the 5 minute chart, I saw the corrective move lower yesterday and into today, stall near the 50% retracement of the move up from the low yesterday. Morever, the rally today was seeing the 100/200 bar MAs (blue and green line) holding support.
This is a snapshot from the video with some comments I just added.
I warned in the video for “giggles” to watch the 200 bar MA for short term clues. Move below could shift the bias back down with the 50% as the target.
So what happened?
The GBPUSD on the 5 minute chart ended up falling below the “just for giggles” 200 bar MA (green line in the chart above). The fall was measured /limited with up and down price action (see chart above), but note how the 100 bar MA (blue line on the chart below), held resistance. The bias was shifting more to the downside.
Ultimately, the price did move more to the downside with momentum. That move took the price from the 200 bar MA on the 5 minute chart at 1.0770 to the US low at 1.0657. Not a bad move.
The low did attract dip buyers ahead of the 50% at 1.06414, and we are seeing a rotation back toward the now falling 100/200 bar MAs going into the close.
The point is… the morning videos are a way to get your arms around some key levels and also to understand a thought process given the bias, the risk levels, the view from longer, intermediate to sometimes even shorter term charts.
So be sure to check the videos out each day.
You can find the full video from this morning HERE.