The NZDUSD closed the week ago at 0.5990, just below the important 0.6000 level. The price has moved lower this week. The high a Monday reached 0.60007 – call it 0.6000.
The price just reached a new low of 0.57498. From the high, that’s a decline of 251 pips or 4.18%. That’s pretty big move in weeks time.
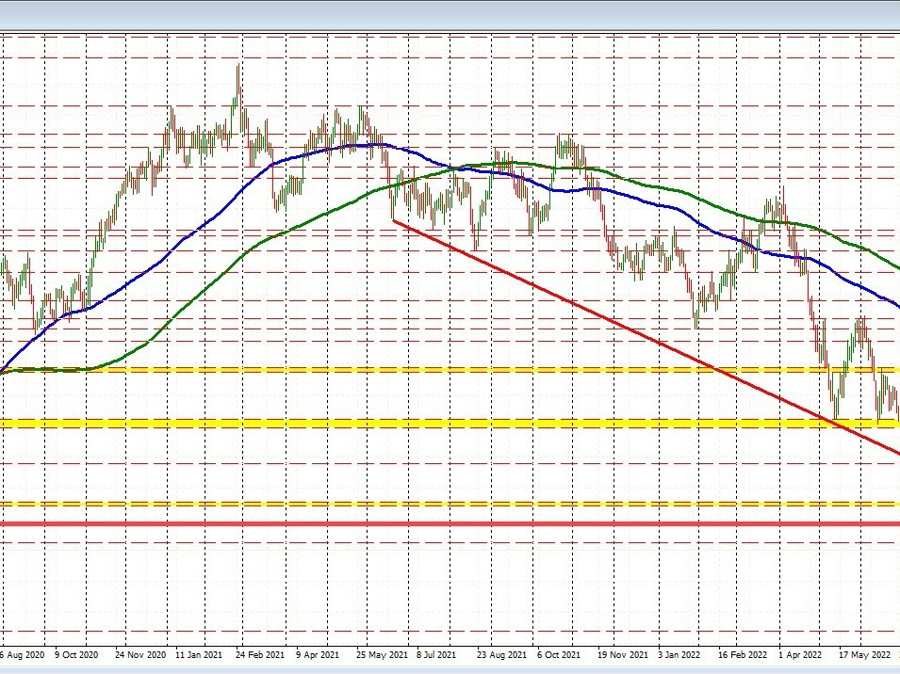
Looking at the daily chart above, the price moved below a swing area between 0.5909 and 0.5921and corrected into that area on Wednesday, only to find willing sellers. Bearish. The price trades to the lowest level since March 24, 2020. The pandemic low did reach much lower at 0.54668. So there is room to roam still.
A close risk level on the daily chart above might be the April 2020 low price at 0.58425 ahead of the broken trend line on the daily chart and the swing area near the 0.5920 area.
Drilling down to the hourly chart below, the price today fell back below an old trendline, and stayed below that level on a corrective move in the New York session (see green numbered circle 7).
The last few hours have seen a acceleration to the downside as stocks continue the run to the downside and risk off sentiment prevailed.
If the buyers are to take more control on the hourly chart, it would take a move back above the old trendline to hurt the bearish bias. That level comes near 0.5810 (and moving lower). Move back above that level, and we could see a run toward the daily targets at 0.58425 and 0.5920. Until then, the bears remain in control.