While the USDJPY was trading to new highs going back to 1998, the EURJPY overnight was falling short of the highs from June at 144.35, and from September 12 at 145.628. The EURJPY high reached 143.69 today before running to the downside on the intervention.
Looking at the weekly chart, the September high and high for the year was also the highest level since the last week of December 2014. The high in 2014 reached 149.713. That high was the highest since October 2008. The 2008 high reached just short of 170.00.
In contrast, the USDJPY reached the highest level since 1998 today.
So although the BOJ is concerned about the USDJPY (JPY weakness), because of the weakness of the EURUSD, the EURJPY is not as alarming. It is higher but it has been much worse.
What was the impact of the EURJPY today from a technical perspective?
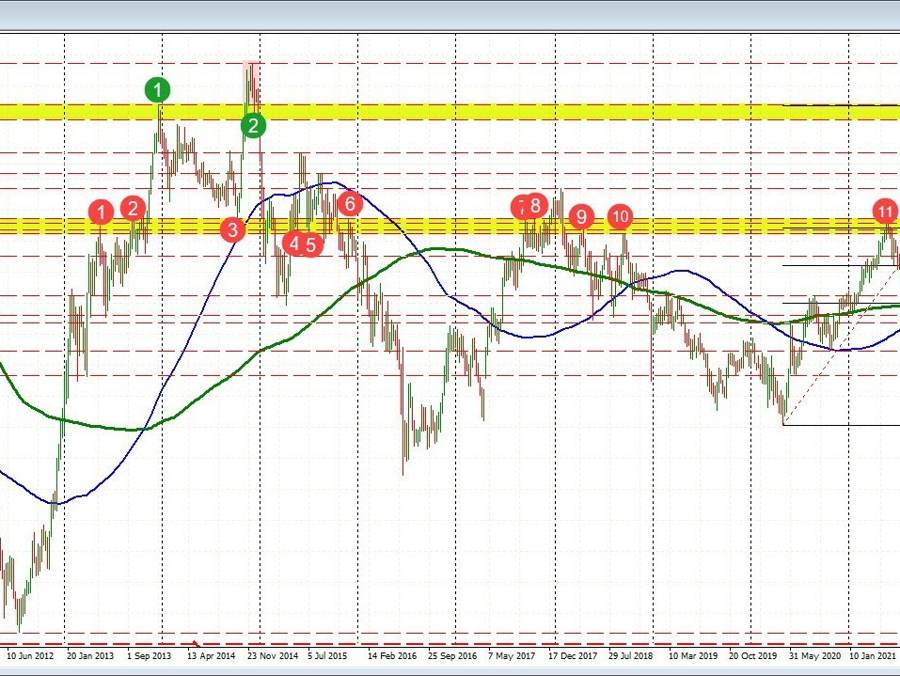
Taking a broad look at the weekly chart above, the price high in September reached toward the high from the end of 2013 at 145.63 area. That high was breached in 2014 on the pairs move to the high that year at 149.71, but fell back below the 145.63 level at the end of 2014 and did not return to the area until this month. The 144.20 to 145. 628 is now resistance (see green numbered circles).
On the downside, the best support on the weekly chart now comes in between 133.15 and 134.58. That area is home to a number of swing levels on that chart (see red numbered circles and lower yellow area). The price low today reached to 138.69 which is near the middle of that range.
Drilling to the daily chart below, the price decline took the EURJPY pair below a swing area at the 142.314 level and to and through the 100 day MA at 139.173. That break below the MA was short lived however, as buyers leaned against the upward sloping trend line at 138.25. The low price reached 138.697. With the price trading at 140.00, it trades toward the lower end of that range with support down to 138.25 and resistance above up to 144.252.
Taking the analysis one step further to the hourly chart below, the price tumble today initially found support right at the 100 day moving average near 139.174. The price corrected higher toward a resistance area between 140.63 and 141.09. Moving up to 141.36 through that level, buyers turned back to sellers. A new low was made but momentum could not be sustained. The price reestablish support against the 100 day moving average at 139.174.
What now?
If the buyers are to take more control, getting above the aforementioned swing area between 140.63 and 141.09 followed by the 50% midpoint of the move down this week at 141.365 would be needed to be broken. Move above that a move toward the 142.26 – 142.436 would be the next major target.
On the downside, a break back below the 100 day moving average at 139.174 should lead to more selling on the 2nd attempt (see the chart below).
So overall, the EURJPY is higher historically, but it has been worse. In the short term, the move lower did send the price to a key support level near the 100 day moving average. Sellers had their shot, and they missed. However, the move also reestablished some resistance levels that would need to be broken in order to keep the bullish bias from the longer term intact.