The major US indices are pushing the early session highs after a dip lower after the open.
- Dow industrial average is making new highs up to 32769.29.
- S&P reached a new high at 4122.80. The prices up 48.72 points or 4121.21
- NASDAQ index reached a new high of 12356.91. It currently trades at 12352.96 up 190.84 points or 1.57%
US yields are lower across the board with the 10 year now down -4.2 basis points at 2.638%. The 30 year yield is back below the 13.0 level at 2.987%.
The NASDAQ index is currently up 4.42%.
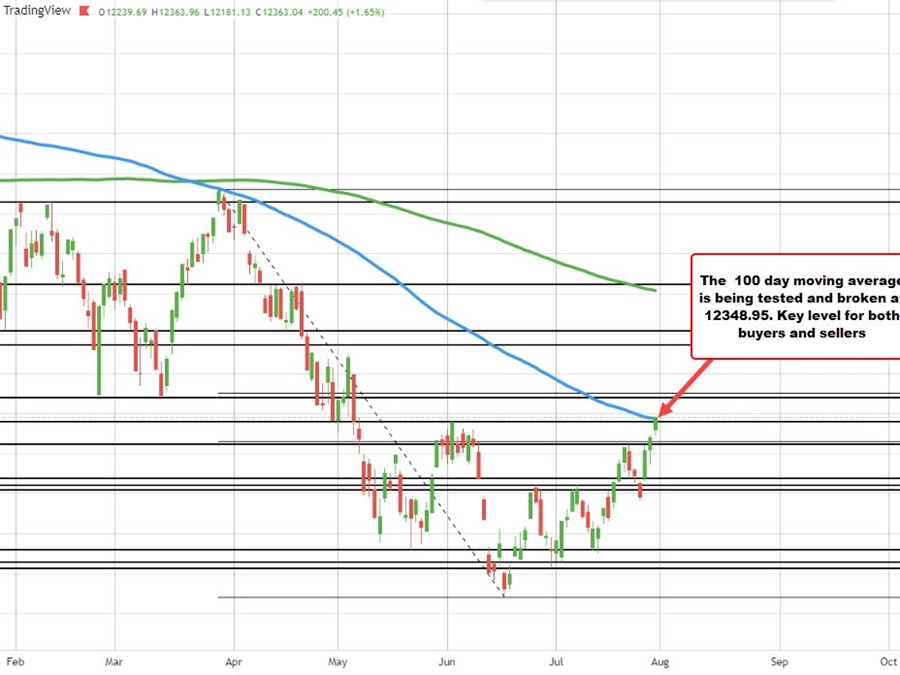
Looking at the daily chart above, the price high at 12359.13 moved above the 100 day moving average at 12348.92. The last time the price closed above its 100 day moving average was back on January 4. The price tested the 100 day moving average in early/mid January and once again at the end of March and into early April.
A move above and staying above is needed to increase the bullish bias going forward from a technical perspective. There may also be sellers against the moving average as risk can be defined and risk be limited.
The next major target comes in at the 50% midpoint of the move down from the end of March high which comes in at 12606.02.