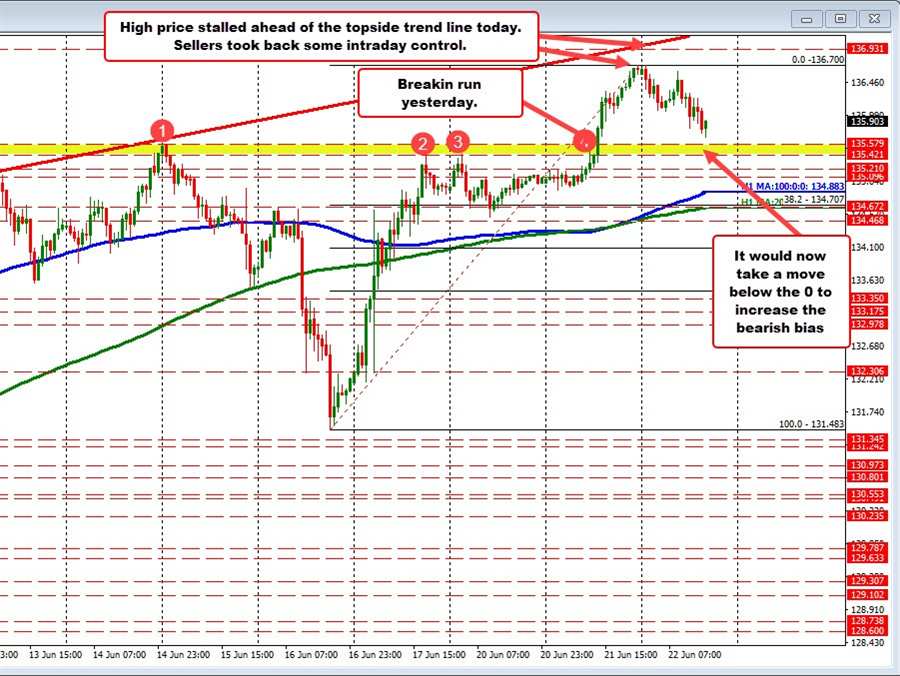
Yesterday, the USDJPY rallied once again and in the process broke above the June 14 high of 135.579. That move took the price to the highest level going back to September 1998 – nearly 24 years ago. The high price closed the day near the high for the day at 136.70. A topside trend line on the hourly chart cut across at 136.95 at the time.
In the early Asian session, buyers turned to sellers and pushed him the price lower. The subsequent – high toward the end of the Asian session – stalled ahead of the highs from yesterday and today at 136.70 (high price reached 136.62). Sellers returned and have pushed the price to a new day low of 135.674.
That low is still ahead of the old high from June 14 at 135.579. It would take a move below that level to disappoint the buyers on the break.
Drilling down to the 5 minute chart, in the Asian session the price moved below the rising 100 hour moving average and then retested that moving average before heading lower. The move to the downside cracked below the rising 200 bar moving average (green line)
However, after the correction stalled ahead of the 38.2% retracement of the day’s range yesterday, buyers return to push the price back up toward the highs for the day. As mentioned above, the price could not extend to the 136.70 high level. As a result, buyers turned back to sellers pushing the price back below the aforementioned 200 and 100 bar moving averages.
What now?
Both the hourly chart, the old high at 135.579 still needs to be broken to worry the buyers. Absent that, and the market is more balanced between buyers and sellers in the short-term, but the buyers still hold more control.
On the topside, looking at the 5 minutes chart, the price would need to get back above the 100 and 200 bar moving averages on that chart – and stay above – to increase the bullish bias with a move above 136.325 as another target to get above (see green numbered circles in the chart below). The focus would then return to staying above the shorter-term moving averages (100/200 bar moving averages on the 5 minute chart).
So for now, the battle is on between support below off the daily chart resistance above off the 5 minutes chart.