The major US indices are trading to new session highs. The gains are led by the NASDAQ index which is up by 2.72%.
Technically, both the Dow Jones and S&P index have moved above their respective 200 hour moving averages.
Looking at the S&P hourly chart above, it’s 200 hour moving average comes in at 4111.68. The current price is trading at 4133.21 up 75.3 points or 1.85%. The price is also just above its 38.2% retracement of the move down from the March 30 high at 4126.83. Stay above the 1 200 hour moving average keeps the buyers in control.
Looking at the Dow chart below, it too moved above its 200 hour moving average at 32833.04 (green line in the chart below). The price yesterday extended above the 38.2% retracement at 32490.93. The next target comes against the 50% midpoint at 33063.99. Like the S&P stay above the 200 hour moving average keeps the buyers in control.
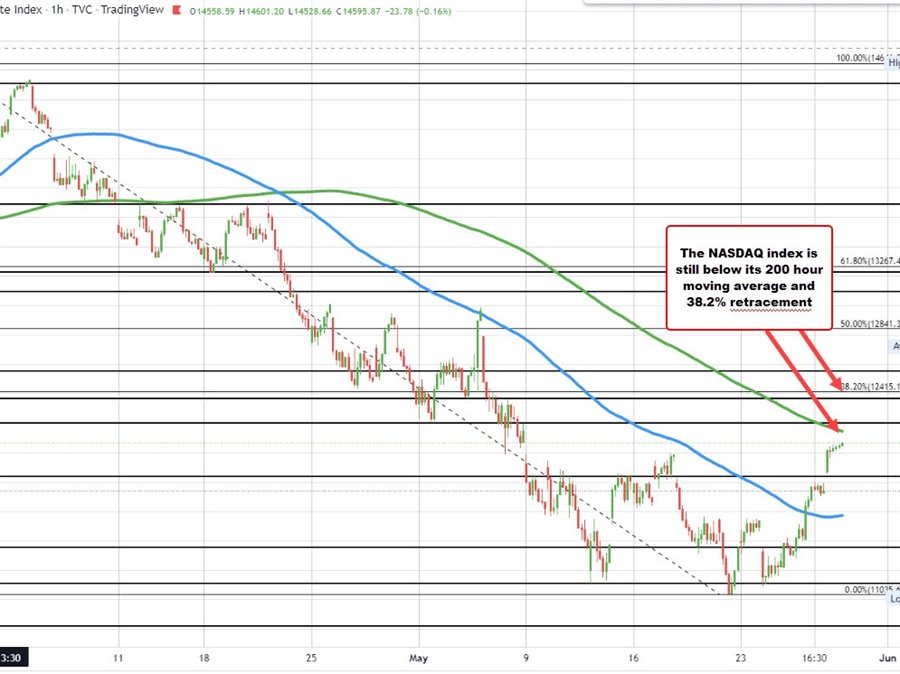
Finally, although the NASDAQ index is the biggest mover today, it still remains below its falling 200 hour moving average currently at 12143.75. The NASDAQ index is currently up 327 points or 2.79% at 12068. It is still 75 points away from its 200 hour moving average. Looking at the hourly chart, the price has not traded above its 200 hour moving average since April 8. Yesterday the price moved and closed above its 100 hour moving average for the 2nd time since May 4. On May 4 the price closed above the moving average but gap lower the next day and had not been above the level since that day.