The USDCAD moved higher earlier in the North American session helped by flows out of the riskier “commodity currencies” and into the USD (on the US stock declines).
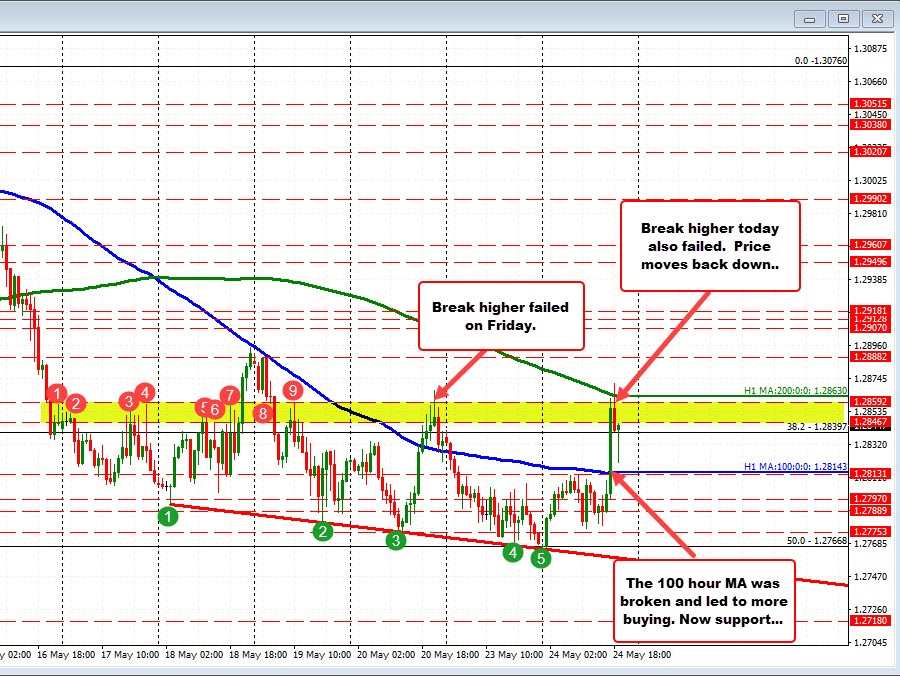
The pair was also influenced by the break above the 100 hour moving average (blue line in the chart above currently at 1.28142).
Earlier today, the USDCAD pair moved up to test that moving average only to back off ahead of it. After consolidating just above the lows from Friday, the price restarted a move higher that was able to break through the MA on the 2nd test.
Buyers in the USDCAD next pushed the price up to test the 200 hour moving average (green line in the chart above). The price did crack through that level, but momentum could not be sustained (stocks started to stabilize), and the price rotated back to the downside.
The subsequent move lower stalled ahead of the 100 hour moving average at 1.28142 (the low reached 1.28205), and the pair is currently trading at 1.28393, near the middle of the bookend moving average levels.
Buyers and sellers will now battle it out, with traders ultimately looking for a break in either direction.