The USDCAD is lower on the day with the price opening at its high and trading down to its low in the North American session. The last 13 or so hours have seen the price trade up and down with a high near 1.2807 and a low at 1.27659.
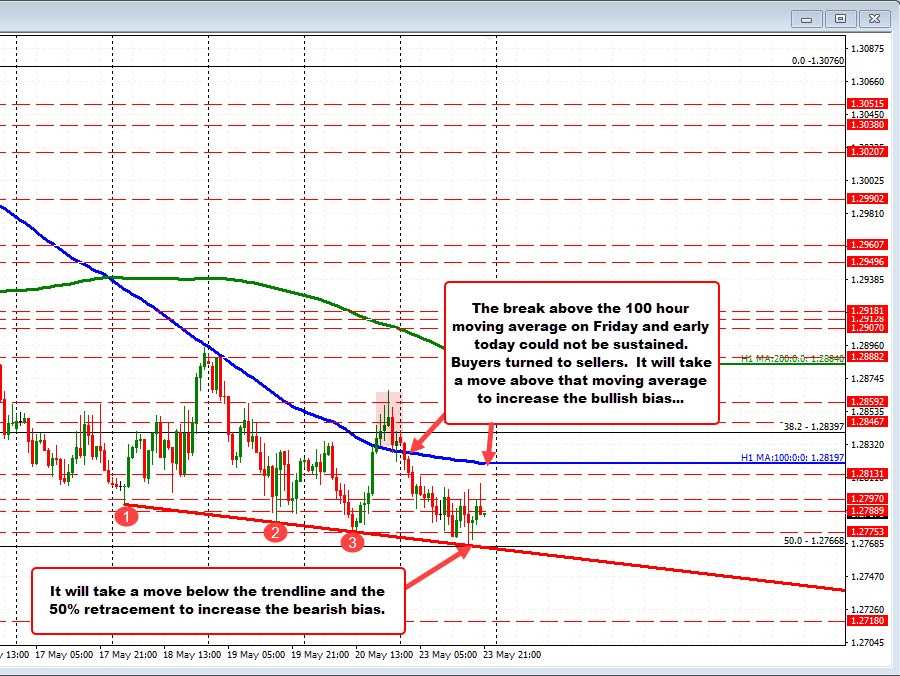
On the downside, the pair stalled near a lower downward sloping trend line on the hourly chart, AND the 50% midpoint of the move up from the April 21 low. Those levels come in near 1.27668. It will take a move below that level to increase the bearish bias.
On the topside, the 100 hour MA is the key resistance today and going forward. That MA comes in at 1.28197. On Friday ,the pair moved above that MA line at 1.28309 on its way to a high of 1.28674 (on Wednesday and Thursday, the moving average stalled the rallies). However momentum could not be sustained. The price moved down into the close but closed just above that MA line.
Today, the price opened above the 100 hour moving average, but moved below in the 2nd trading hour. The momentum increased to the downside as buyers turned to sellers, until reaching the 1.27668 area where buyers started to lean against the aforementioned support target.
The current price is trading at 1.2782, above the 50% and trend line on the downside, but comfortably below the 100 hour moving average on the topside. Flip a coin but since the price is near the low and below the 100 hour moving average (after failing on Friday’s break), the sellers have the small advantage short-term advantage.