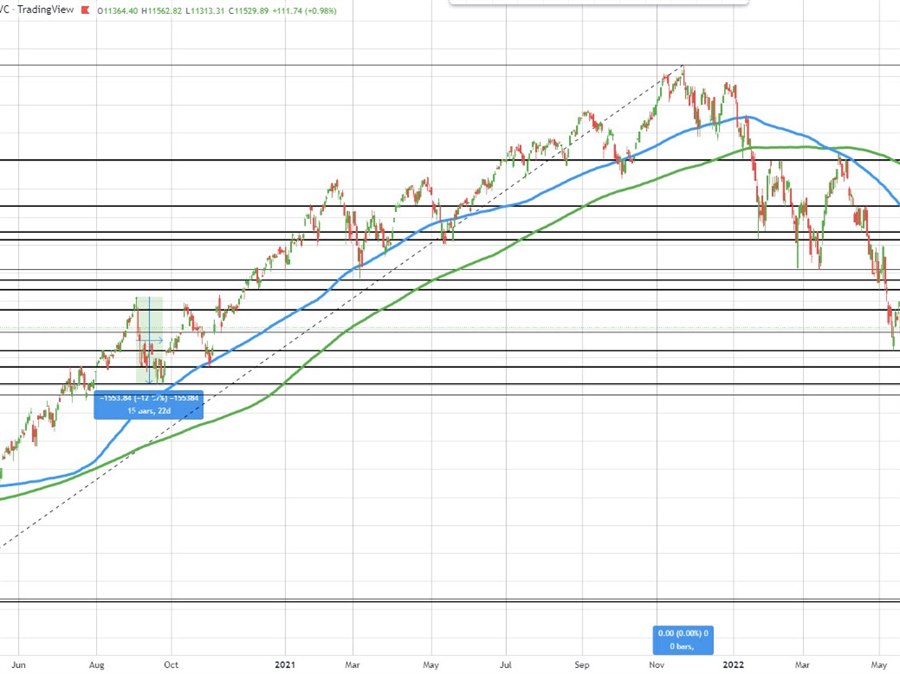
The NASDAQ index has been trading up an down today. The high price reached 11562.82. The low price extended to 11313.31. Near the midpoint of that range sits the 50% midpoint of the trading range since the post pandemic low. That midpoint comes in at 11449.29.
The current prices above that level at 11489, above the midpoint level. Tilt is a little to the bullish side.
Nevertheless, the ups and downs today around the midpoint of the long-term range suggests that the traders are trying to figure out what’s next. Is it a time to correct back to the upside away from the 50% level, or does the price head back toward a retest of the lows from last week at 11108.76?
As a guide, the move down from the November 22 high to the low price reached on May 12 took the NASDAQ index down -31.48%.
Going back to the sell off from the pandemic back in March 2020, that selloff from the global economy shut down, subtracted -32.04%. So the moves lower are nearly the same.
Of course inflation may have peaked (at 8.5% ish) but oil prices remain elevated.
Wheat prices this week moved up toward the spike highs seen on March 8, and well off the corrective lows from March 30. The high reached $13.63 on March 8. The low extended to $9.72 on March 30. The current price is at $12.09.
Corn prices are near their highest level going back to September 2012.
Moreover, retailers like a Target said they have been holding back on price increases mainly as a result of higher costs from energy/employment. However, if they and others decide to push prices up, inflation from the goods standpoint may have another leg to the upside.
Needless to say, food inflation, energy inflation and supply chain constraints as a result of China Covid lockdowns has the Federal Reserve concerned about persistently high inflation which could lead to rates moving much higher than the neutral rate of near 2.5%.
If so, where do stocks belong?
Back at the start of the pandemic, growth was expected to slow, but inflation was also expected to move sharply lower as well. Central bank policy and fiscal policy was growth oriented and expansionary. That dynamic is not the case now.
Looking at the S&P index, the story is a bit different.
On the daily chart below, the price low from last week reached 3858.87. That is still above the 38.2% retracement of the move up from the March 2020 low which comes in at 3815.20.
The decline from the January high to the low reached last week took the S&P index down -19.92%. The decline back in March 2020 saw the S&P index fall -35.41%.
So on a relative basis, the S&P is fairing better now than the March 2020 pandemic selloff. The index is also fairing better than the NASDAQ index. The correction is so far not even reached the 38.2% retracement of the move up from the March 2020 low. That puts the correction still in the plain-vanilla variety. Traders will be watching the 38.2% retracement on another dip going forward.