The USDCAD is working on its eight straight day to the downside (stronger CAD). Adam Button talks to the fundamentals that are underlying the move into the loonie in his interview here.
Technically, the move to the downside has been seen a bias shift to the downside on the daily chart that started earlier in the month. At that time the USDCAD run to the upside stalled against a lower swing area (see black numbered circles) ahead of the extremes going all the way back to December 2020 (see red numbered circles).
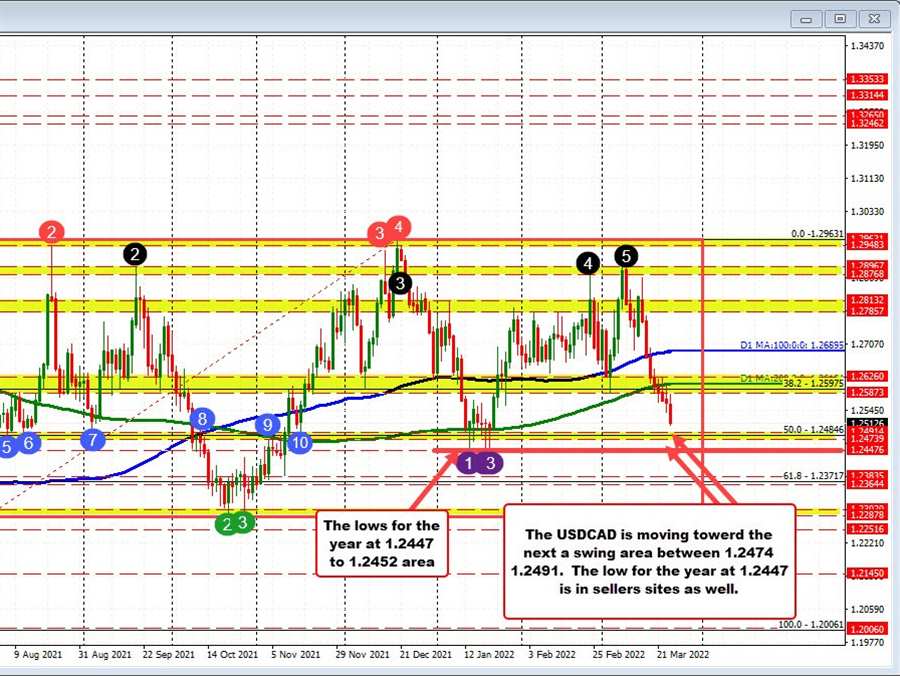
At the highs this month, the price tested that swing area between 1.2876 and 1.28967, and found sellers. The subsequent swing high on March 15 stalled ahead of that level as well, and gave the sellers the go-ahead to push lower.
That high on March 15 has now led to eight straight days to the downside. The price over that time period has moved from 1.28706 to the low today of 1.2508 (close to 300 pips). The current price trades at 1.25206.
Technically, the pair was also given a further push to the downside after breaking below its 100 day moving average (blue line) and more recently the 200 day moving average at 1.26104. Admittedly, the price traded above and below the 200 day moving average over three trading days, but yesterday the high price stalled ahead of that level and gave sellers the needed confirmation to push lower.
The next key target on the downside comes near the 50% midpoint of the move up from the June 2021 low. That midpoint comes in at 1.24846. It is also between a swing area between 1.24739 at 1.24914. Below that area and traders would target the swing lows for the year at 1.24476.
Taking a broader look, since the beginning of July 2021, the price action has seen its fair share of ups and downs. Since the October 2021 lows, the swing lows have been higher. However the early March swing low at 1.25873, was also broken over the last few days giving the bears more downside confidence. It would now take a move back above that level and the 200 day moving average at 1.26104 to disappoint the sellers and shift the bias/trading barometer back to the upside. Until then, the sellers remain more in control with the 2022 low 1.24476 the next meeting hurdle. From there the door opens for a run toward other swing levels near the 1.2372, and then the lowest lows since July 2021 near the 1.2295 area.
What does the trend move lower over the last eight days look like on the hourly chart?
Looking at the hourly chart below, the last 8 trading days first saw the price move below the near converged 100 and 200 hour moving averages near 1.2780 on March 15. On March 16, after testing its 100 day moving average near the low, the price did spike higher and move above the falling 100 hour moving average but could not get above the 200 hour moving average (green line).
Since then, the price has trended lower. The last few days has seen more of an up and down consolidation above and below the 200 day moving average, which has allowed the 100 hour moving average (blue line currently at 1.2585) to catch up with the price. However the high price yesterday and again today stalled against that 100 hour moving average, giving the sellers the upper hand and helped to push the price lower.
If the prices to rebound higher, it has to get back above the 100 hour moving average as step one.