The EURGBP continued its move to the upside today, a day after the ECB hinted of potential tightenings in 2022.
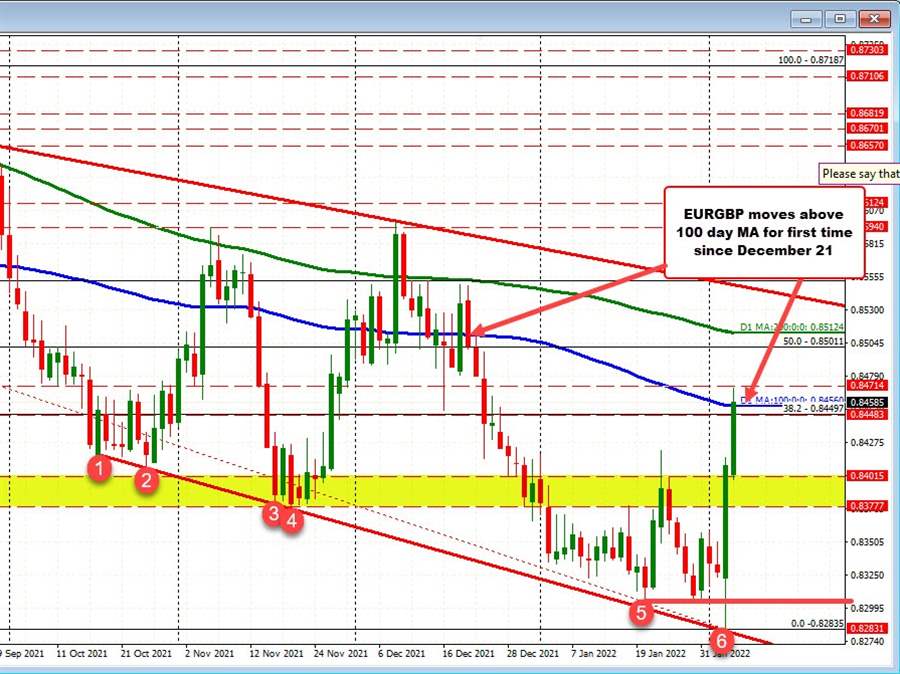
Yesterday the pair swung from a new low going back to February 2020 – taking out the January lows at 0.83048. Looking at the daily chart, the low for the day stalled against the lower trendline on that chart. Buyers leaned against that trendline level, and when the price move back above the 0.83048 level, the squeeze was on (helped by the ECB admittedly).
The snapback move to the upside took the price sharply higher and the trend was continued today with the break of the 38.2% retracement of the move down from the April 2021 high at 0.84497. The price also moved above its 100 day moving average at 0.8456. The high price today reached 0.84696, and has backed off, trading above and below its 100 day moving average over the last six or so trading hours (see hourly chart below).
Looking at the hourly chart below, the pair is having some cause for pause around the 100 day MA. However, it is also staying above a swing area between 0.8414 and 0.8424.
If on a corrrection lower, the price can stay above that area, the buyers would keep the short term control. Move back above the 100 day MA – and stay above – would increase that bullish bias.
Conversely, move below the 0.8414 level and a further move down toward 0.8400 (38.2% area) would be targeted. Buyers on the run higher would not be all that thrilled on a move back below that level.
Buyers have made a play over the last two days and today moved outside the topside of the up and down trading range. Can they keep that momentum going? Stay above the 0.8414 to 0.8424 will be eyed for the support/risk defining level now.