The major US indices are now all positive with the NASDAQ leading the way. The S&P index is up as well by 0.82% after opening near unchanged.
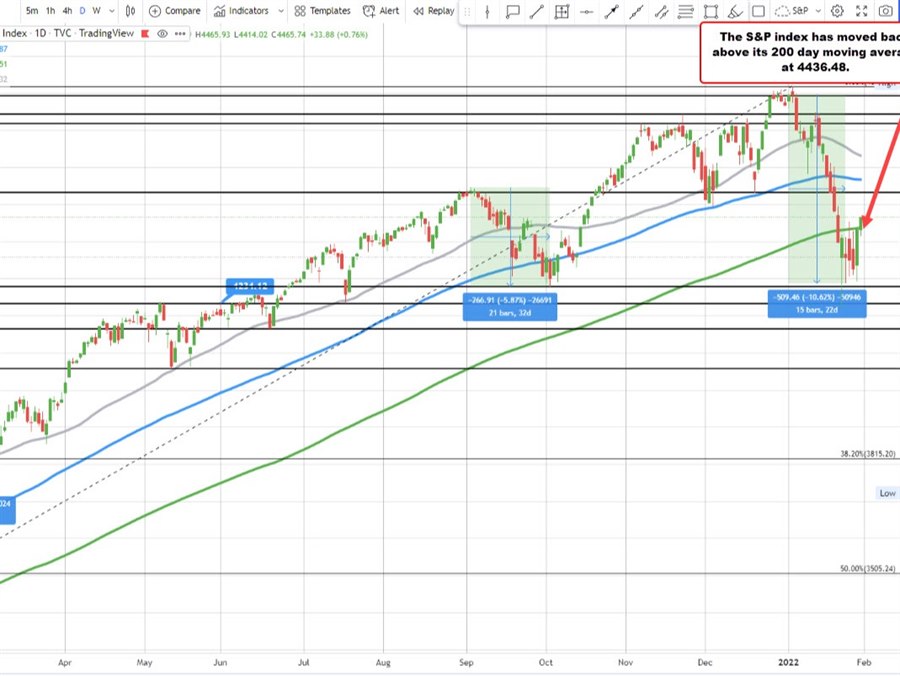
Technically for the S&P index, it has moved back above its 200 day moving average currently at 4436.50. The current price is trading at 4468.34, up 36 points or 0.82%. Moving back and closing back above that 200 day moving average is more positive from a technical perspective.
The NASDAQ index is leading the way with a 274 point rise or 1.98%. The price there is trading back above the 14000 level at 14042. The low price last week reached 13236.56. The price has since rebounded over 6% from that low. The NASDAQ index is still well below its 200 day moving average at 14727.74. Nevertheless, the rebound is giving buyers some additional confidence at the sharp swing to the downside may be over.
For the Dow industrial average, it is currently up 85 six points or 0.25% at 34813. It is approaching its 200 day moving average at 34976.