When I look at a chart, I focus on who is in control. To determine control, you need clues that give a bias. I like to technical clues like moving averages (100/200 bar MAs), trend lines, swing areas where support and resistance floors and ceilings are established and retracement levels.
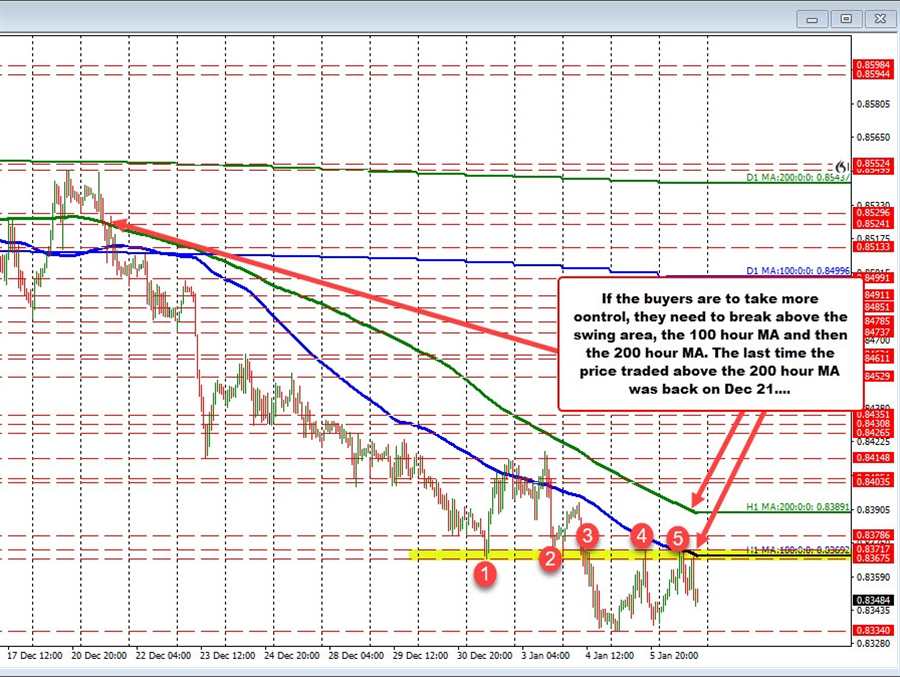
In the EURGBP, looking at the hourly chart, the pair has a swing area defined by lows on Friday and Monday and highs on Tuesday and Wednesday and Thursday between 0.8367 and 0.83717 (see the red numbered circles).
Also the falling 100 hour MA (blue line) is in play at 0.8369 currently (and moving lower). That is also in the swing area. The high price today, tested that MA line on two separate occasions and found sellers.
So that area and trend line defines the short term bias. Stay below – like the price is now – and the bias is negative. Move above, and the bias will shift a little more in the buyers favor – as long at the price can stay above.
What would increase that bullish bias?
Get above the 200 hour MA at 0.8389.
The price of the EURGBP has not traded above the 200 hour MA since December 21. The price will need to get and stay above that MA too to increase the bullish bias (confirm the break above the 100 hour MA).
Absent those moves, and the sellers remain in control