The USDJPY stalled near the swing high from November 2017 and rotated lower
The USDJPY is closing the trading week at/near the week lows. That breaks a string of 5 straight higher weeks for the pair which saw the price move from 109.10 to the high this week at 114.69 (559 pips).
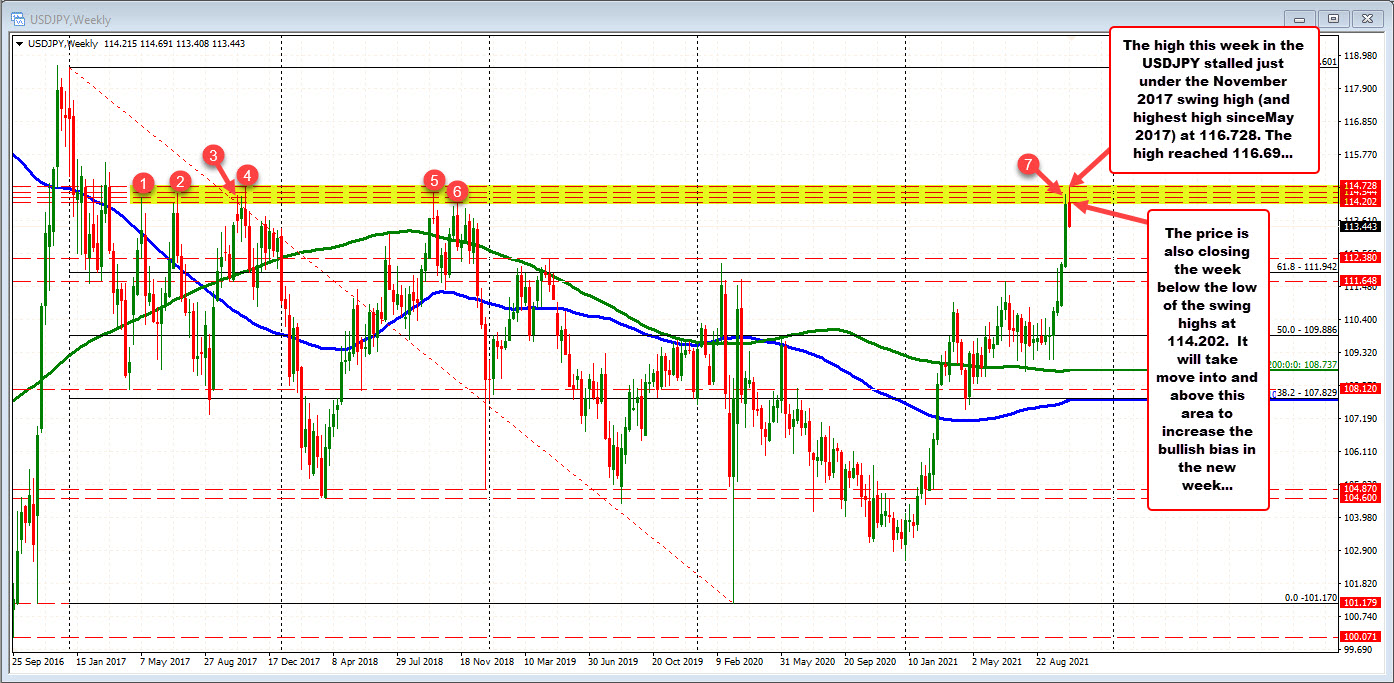
The high price this week stalled just ahead of the November 2017 high price of 114.728 (the price got within 3.7 pips of that target). The inability to move above that level help contribute to the decline. The pair also fell below other swing highs levels going back to May 2017 (and 2018 and last week too) between 114.20 and 114.728 (see red numbered circles). That area was a key ceiling going into the trading week last week, and the buyers could not push through it.
It will still take a move above 114.20 to 114.72 to increase the bullish bias in the new trading week.
If the high is in place, and a correction is started, “what levels would help confirm a more bearish bias?”
Drilling to the hourly chart below, the decline off the high is really not that dramatic. In fact although the price is below its 100 hour moving average at 114.122, and 200 hour moving average at 113.959, the pair has not yet reached to the 38.2% retracement of the last trend move higher from the October 4 low. That would be the first downside target to get to and through in the new trading week if the sellers are to assume more control from the buyers. That retracement level currently comes in at 113.21 and that level corresponds roughly with swing lows from October 13 and October 14. So getting below it would be step one.
The next steps would it take the price below the swing low from October 12 at 112.996 (call it 113.00), and then the 50% of the same move higher at 112.754. If those levels can be broken, would open up the door for further downside momentum in the pair.
On the topside, we know from the weekly chart the 114.20 level is the low of the weekly swing highs going back to May 2017. Before that level, traders will eye the 200 hour moving average at 113.959 (green line in the chart below and the 100 hour moving average (blue line in the chart below at 114.122 as levels that the price must stay below if sellers are to keep some control. Absent that and they simply are not winning.