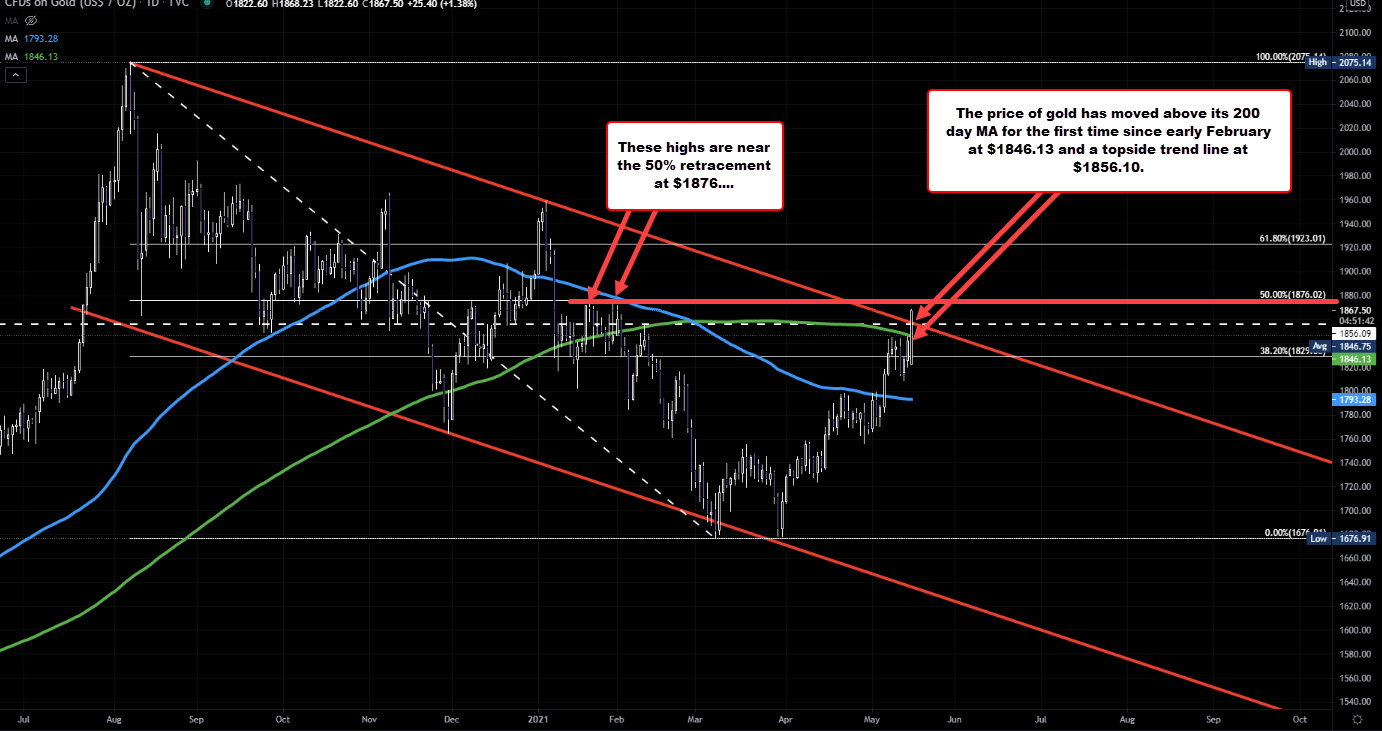
Trendline broken at $1856.10
The price of gold is trading to a new session high of $1868.23. That up 1.35% on the day or $24.82.
Looking at the daily chart, the precious metals making a break above its 200 day moving average for the first time since early February (February 3). The price is also moved above a Topside general trendline near $1856.10. Stay in above those two levels technically keep the buyers/balls more control. It would take a move below each to tilt that bias back lower.
On the topside, there still is some work to do to increase the bullish bias. The 50% midpoint of the move down from the 2020 high comes in at $1876.07. That is also near swing highs from January 21 and January 29
This article was originally published by Forexlive.com. Read the original article here.