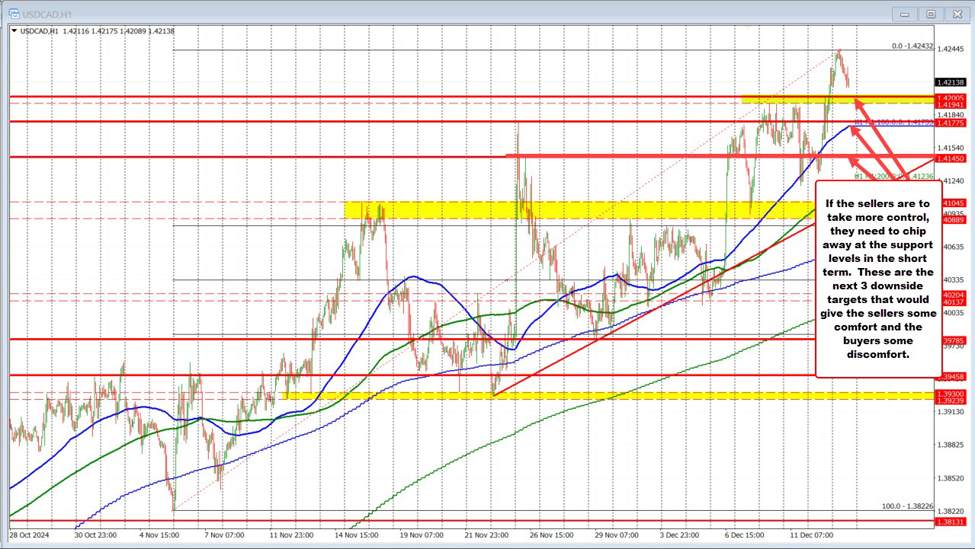
The USDCAD moved higher today, extending to a new 4+ year high of 1.4243, surpassing levels last seen in April 2020. The next key target is 1.4264, the high from April 2020. A break above this level could pave the way for further upside momentum.
Why Multi-Year Highs Matter
When an asset trades at multi-year highs, the prevailing trend often persists because:
- Trends are fast and directional.
- Trends tend to extend beyond expectations.
As a result, sellers must prove their ability to regain control in order to shift the bias lower.
Key Technical Levels for Sellers
To tilt the bias more to the downside, sellers must break through these levels:
- Initial Support at 1.4194: This level, just below 1.4200, acted as a ceiling earlier this week and is now critical short-term support.
- Rising 100-Hour Moving Average & November 26 High (~1.4177): Breaking below these levels would indicate a shift towards bearish momentum.
- Next Downside Target at 1.4145: A move below this level would strengthen sellers’ confidence and increase buyers’ discomfort.
Summary
- Above 1.4264: Buyers gain further momentum for an extended rally.
- Below 1.4145: Sellers start to wrestle back control and establish a more bearish short-term outlook.
Until these levels are decisively breached, buyers remain in control, albeit with sellers needing to prove their strength to change the trend.
This article was originally published by Forexlive.com. Read the original article here.
