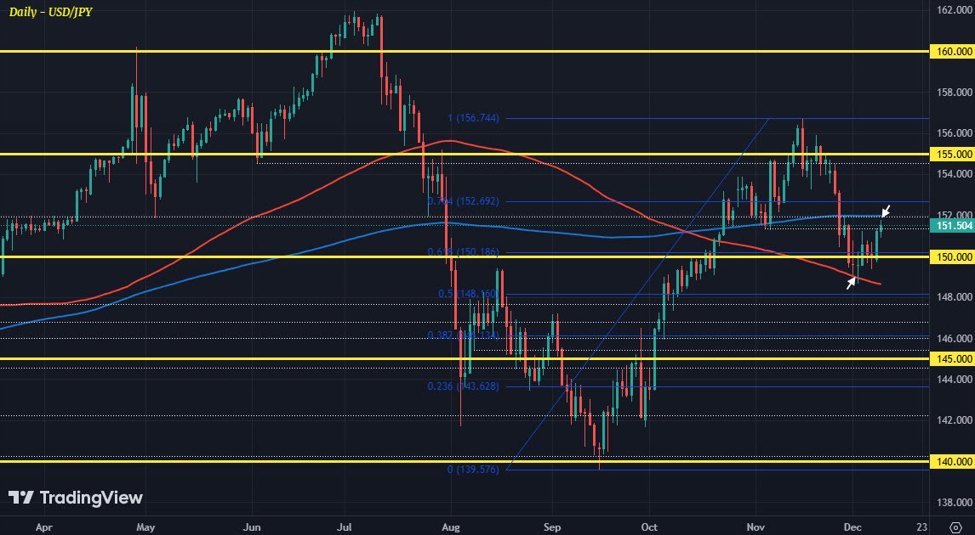
USD/JPY daily chart
The pair might be trading a little higher today, up 0.2% to 151.50 but it’s not really saying all too much. Looking at the chart above, the most recent bounce comes amid a defense of the 100-day moving average (red line). And since then, buyers have slowly gathered more conviction but nothing outstanding as of yet. The key upside level to watch now is the 200-day moving average (blue line), seen at 151.97 currently.
Put together, they outline more of a ping pong range for the pair. The bond market is also seeing some offers this week, so that is helping with the slight bounce. 10-year Treasury yields are up to 4.21% now, with the low last week touching 4.12%. But again, it’s not anything too striking.
All else being equal, traders will be looking to the US CPI report tomorrow to potentially settle the score. That being said, there is a case where we might not learn much from the inflation data.
The odds of a Fed rate cut next week are at ~85% now and barring any major surprises, Powell & co. are likely to deliver one final cut before pausing early next year.
The bigger question will be how much of any stickier price pressures from the latest report here will translate to the outlook for next year. The consideration will have to be alongside Trump tariffs as well, so there’s that.
But in the more immediate term i.e. for next week, it shouldn’t likely change the outcome for the Fed. But we’ll see how the market reacts. It wouldn’t be the first time the Fed gets bullied into a decision one week before a FOMC meeting.
