Fundamental
Overview
The Nasdaq tested the
all-time high following Trump’s victory and the red sweep as the market started
to look forward to bullish drivers like tax cuts and deregulation.
One potential bearish
reason people are looking at is rising Treasury yields. That’s generally
bearish when the Fed is tightening though as the market looks forward to an
economic slowdown.
Right now, the Fed’s
reaction function is that a strong economy would warrant an earlier pause in
the easing cycle and not a tightening. That should still be supportive for the
stock market.
If the Fed’s reaction
function changes to a potential tightening, then that will likely see the stock
market correcting lower.
Nasdaq
Technical Analysis – Daily Timeframe
Nasdaq Daily
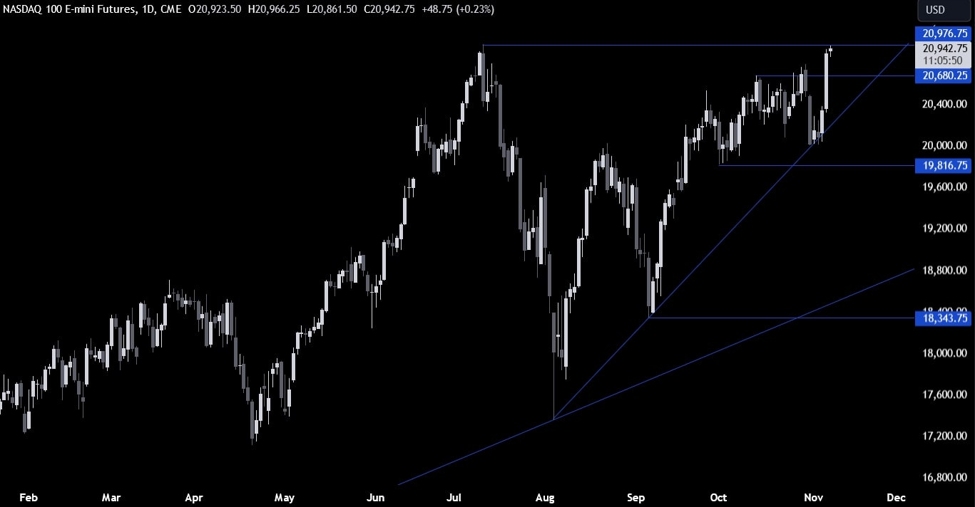
On the daily chart, we can
see that the Nasdaq bounced on the trendline and extended the rally into the
all-time high following Trump’s victory. The sellers will likely step in around
these levels with a defined risk above the all-time high to position for a drop
back into the trendline. The buyers, on the other hand, will want to see the
price breaking higher to increase the bullish bets into new highs.
Nasdaq Technical
Analysis – 4 hour Timeframe
Nasdaq 4 hour
On the 4 hour chart, we can
see more clearly the incredible rally since the bounce on the trendline. The
price is now testing the all-time high with the Fed’s decision looming. The
momentum is strong but if we get a bearish reaction to the Fed’s decision in
the afternoon, the dip-buyers will likely step in around the 20700 level. The
sellers, on the other hand, will look for a break lower to target the
trendline.
Nasdaq Technical
Analysis – 1 hour Timeframe
Nasdaq 1 hour
On the 1 hour chart, we can
see that the strong bullish momentum on this timeframe is fading a bit as the price
broke below the minor upward trendline. This price action might signal a
pullback into the 20700 level. The red lines define the average daily range for today.
Upcoming Catalysts
Today we have the US Jobless Claims and the FOMC Policy Decision. Tomorrow,
we conclude the week with the University of Michigan Consumer Sentiment report.
