- EUR/USD climbs above 1.0950 on soft US PPI report for July.
- Market speculation for a 50 basis points interest-rate cut in September has slightly improved.
- ECB Rehn supports more rate cuts to boost Eurozone economic growth.
EUR/USD gains sharply above 1.0950 in Tuesday’s New York session. The major currency pair rises as the US Dollar (USD) dips after the United States (US) Producer Price Index (PPI) data turned out softer than expected in July. The US Dollar Index (DXY), which tracks the Greenback’s value against six major currencies, falls sharply below 103.00.
The data showed that the annual headline came in lower at 2.2% from the estimates of 2.3% and June’s figure of 2.7%, upwardly revised from 2.6%. In the same period, the core PPI, which excludes volatile food and energy prices, decelerated to 2.4% from expectations of 2.7% and the former release of 3%. Month-on-month headline PPI rose expectedly by 0.1%, while the core figure remained flat.
Slower growth in prices of goods and services at factory gates has boosted expectations of a big interest rate cut announcement by the Federal Reserve (Fed) in the September meeting. According to the CME FedWatch tool, 30-day Federal Funds Futures pricing data shows that traders see a 54.5% chance that interest rates will be reduced by 50 basis points (bps) in September. The likelihood of a 50 bp rate reduction has increased from the odds of 49.5% after the release of the soft PPI report but still remained far below the 68% chance recorded a week ago.
Daily digest market movers: EUR/USD capitalizes on weak US Dollar
- EUR/USD jumps to near 1.0950 as the US Dollar slips after the release of the soft US PPI report. The US Dollar is expected to face more volatility ahead as the US Consumer Price Index (CPI) data for July is lined up for release on Wednesday. The inflation data will significantly influence market speculation about the size and timing of interest rate cuts by the Fed for the entire year.
- Annual headline and core inflation is expected to have decelerated by one-tenth to 2.9% and 3.2%, respectively, with monthly figures growing by 0.2%. The inflation data will indicate whether the Fed will adopt a cautious policy-easing approach or will choose to reduce interest rates more aggressively.
- Meanwhile, the Euro (EUR) faced mild selling pressure after the release of the downbeat German and Eurozone ZEW Survey-Economic Sentiment for August, which is a key measure to investors’ morale. ZEW Survey-Economic Sentiment for Germany and the Eurozone declined sharply to 19.2 and 17.9, respectively. ZEW president Achim Wambach said, “Economic expectations are still affected by a high level of uncertainty, driven by ambiguous monetary policy, disappointing business data from the US economy and growing concern about an escalation of the conflict in the Middle East.”
- More broadly, the Euro’s performance is being guided by market speculation for European Central Bank (ECB) rate cuts. Economists are mixed about the ECB’s monetary policy outlook, namely whether the central bank will cut interest rates aggressively or use a calibrated approach.
- The Eurozone economy grew faster than expected in the second quarter, but its largest country, Germany, is facing a vulnerable demand from domestic and overseas markets. The German GDP contracted by 0.1% in the second quarter of this year. Last week, Finnish ECB policymaker Olli Rehn said that “rate cuts would help the eurozone economy recover, in particular the fragile industrial growth and subdued investments,” Reuters reported.
Euro Price Today:
Euro PRICE Today
The table below shows the percentage change of Euro (EUR) against listed major currencies today. Euro was the strongest against the Japanese Yen.
| EUR | USD | GBP | JPY | CAD | AUD | NZD | CHF | |
|---|---|---|---|---|---|---|---|---|
| EUR | -0.06% | -0.34% | 0.34% | -0.18% | -0.34% | -0.47% | 0.17% | |
| USD | 0.06% | -0.27% | 0.43% | -0.08% | -0.25% | 0.10% | 0.23% | |
| GBP | 0.34% | 0.27% | 0.70% | 0.18% | -0.00% | -0.11% | 0.54% | |
| JPY | -0.34% | -0.43% | -0.70% | -0.53% | -0.67% | -0.82% | -0.17% | |
| CAD | 0.18% | 0.08% | -0.18% | 0.53% | -0.17% | -0.31% | 0.34% | |
| AUD | 0.34% | 0.25% | 0.00% | 0.67% | 0.17% | -0.11% | 0.54% | |
| NZD | 0.47% | -0.10% | 0.11% | 0.82% | 0.31% | 0.11% | 0.66% | |
| CHF | -0.17% | -0.23% | -0.54% | 0.17% | -0.34% | -0.54% | -0.66% |
The heat map shows percentage changes of major currencies against each other. The base currency is picked from the left column, while the quote currency is picked from the top row. For example, if you pick the Euro from the left column and move along the horizontal line to the US Dollar, the percentage change displayed in the box will represent EUR (base)/USD (quote).
Technical Analysis: EUR/USD posts fresh weekly high around 1.0950
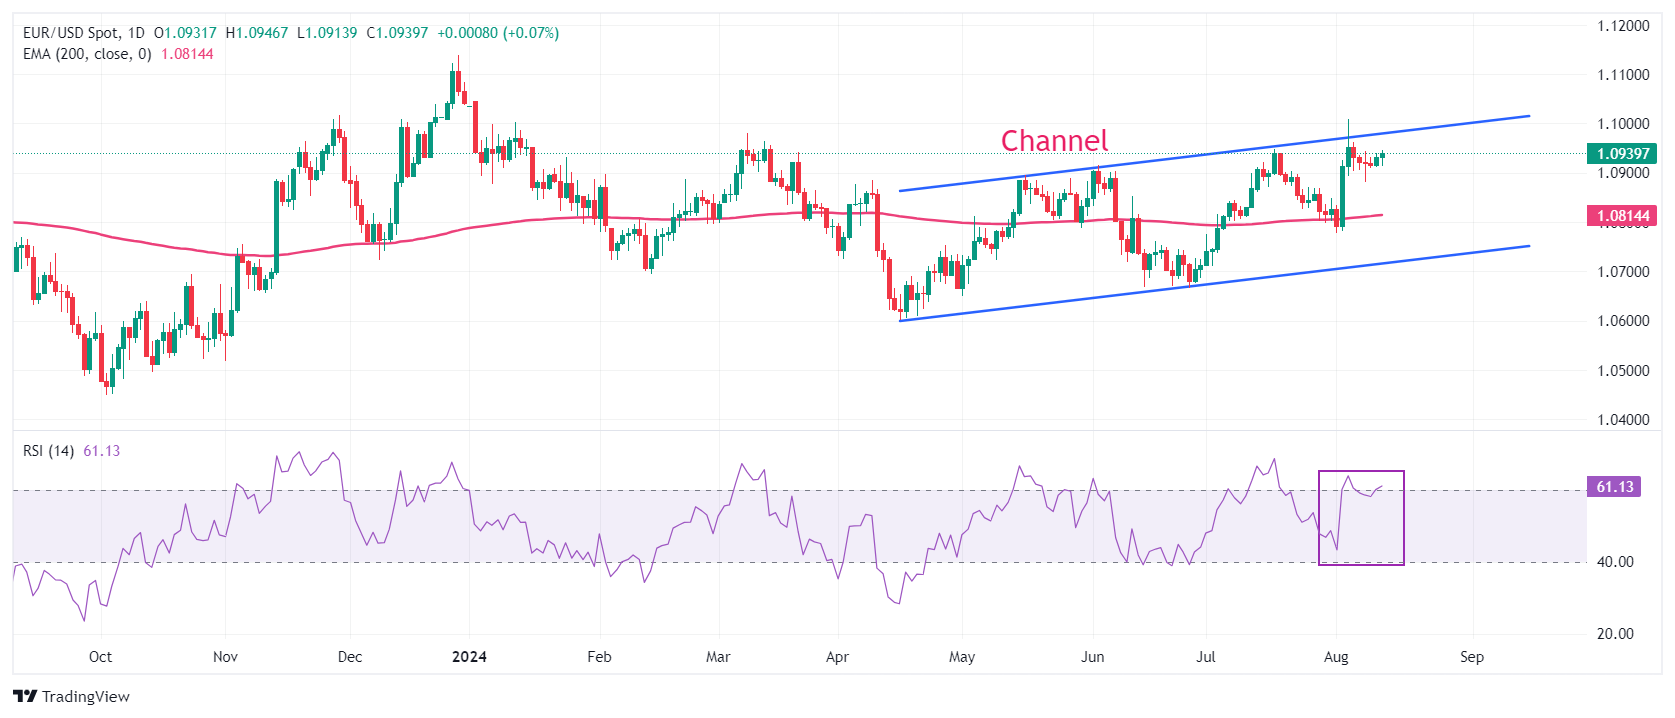
EUR/USD trades close to near the upper boundary of the Channel formation on the daily time frame. A breakout of the aforementioned chart pattern would result in wider ticks on the upside and heavy volume. The 200-day Exponential Moving Average (EMA) near 1.0800 has acted as major support for the Euro bulls.
The 14-day Relative Strength Index (RSI) strives to enter inside the 60.00-80.00 range. If the RSI sustains above 60.00, a bullish momentum will trigger.
More upside would appear if the major currency pair breaks above the August 5 high of 1.1009. This would drive the asset towards August 10, 2023, high at 1.1065, followed by the round-level resistance of 1.1100.
In an alternate scenario, a downside move below August 1 low at 1.0777 would drag the asset toward February low near 1.0700. A breakdown below the latter would expose the asset to June 14 low at 1.0667.
Inflation FAQs
Inflation measures the rise in the price of a representative basket of goods and services. Headline inflation is usually expressed as a percentage change on a month-on-month (MoM) and year-on-year (YoY) basis. Core inflation excludes more volatile elements such as food and fuel which can fluctuate because of geopolitical and seasonal factors. Core inflation is the figure economists focus on and is the level targeted by central banks, which are mandated to keep inflation at a manageable level, usually around 2%.
The Consumer Price Index (CPI) measures the change in prices of a basket of goods and services over a period of time. It is usually expressed as a percentage change on a month-on-month (MoM) and year-on-year (YoY) basis. Core CPI is the figure targeted by central banks as it excludes volatile food and fuel inputs. When Core CPI rises above 2% it usually results in higher interest rates and vice versa when it falls below 2%. Since higher interest rates are positive for a currency, higher inflation usually results in a stronger currency. The opposite is true when inflation falls.
Although it may seem counter-intuitive, high inflation in a country pushes up the value of its currency and vice versa for lower inflation. This is because the central bank will normally raise interest rates to combat the higher inflation, which attract more global capital inflows from investors looking for a lucrative place to park their money.
Formerly, Gold was the asset investors turned to in times of high inflation because it preserved its value, and whilst investors will often still buy Gold for its safe-haven properties in times of extreme market turmoil, this is not the case most of the time. This is because when inflation is high, central banks will put up interest rates to combat it. Higher interest rates are negative for Gold because they increase the opportunity-cost of holding Gold vis-a-vis an interest-bearing asset or placing the money in a cash deposit account. On the flipside, lower inflation tends to be positive for Gold as it brings interest rates down, making the bright metal a more viable investment alternative.

