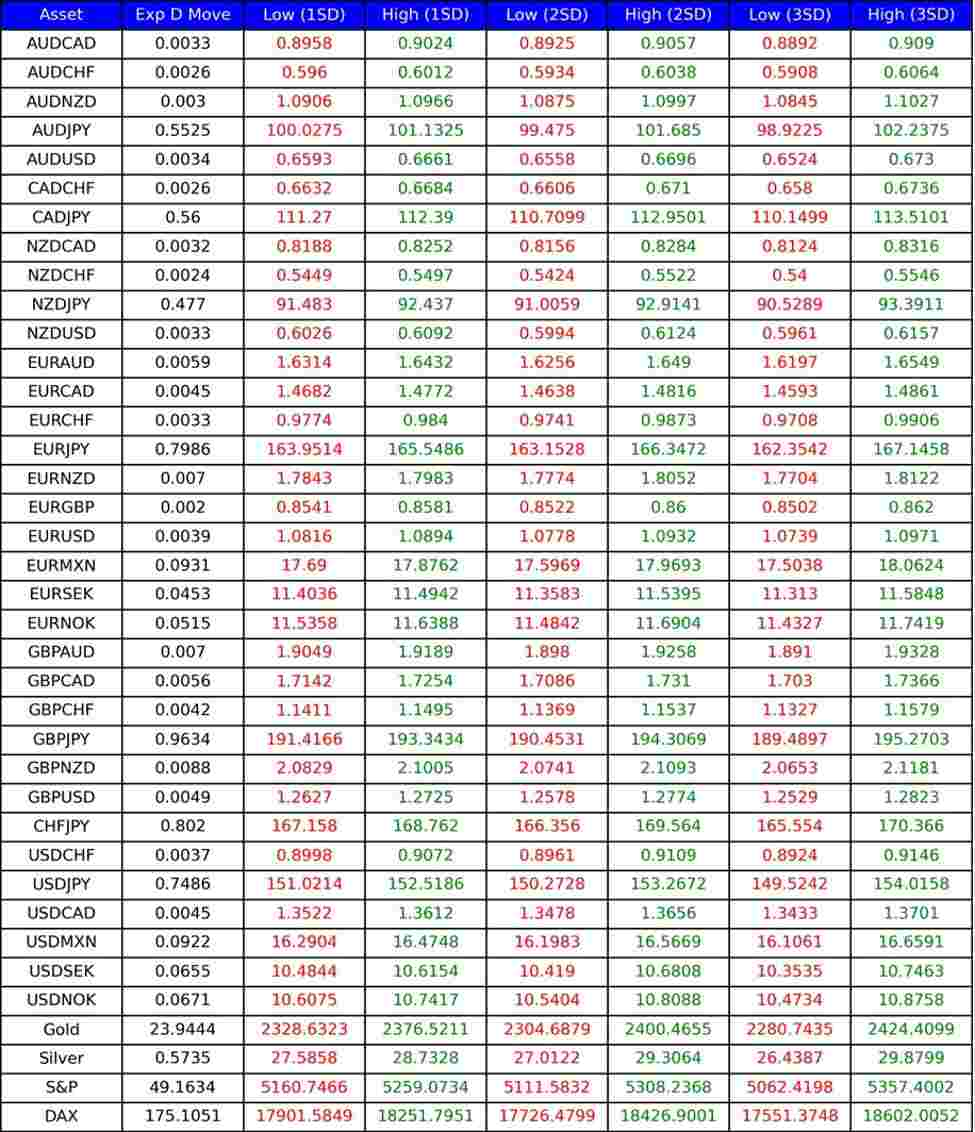
Below is a list of the implied volatility daily ranges for
various assets.
These levels are based on 1-month implied volatility and can
be used as dynamic and market-based levels of support and resistance.
Implied volatility suggests that if prices were normally
distributed, there’s approximately:
- A
68.2% chance that future price movements will stay within 1 standard
deviation of the mean. - A
95.4% chance that they’ll stay within 2 standard deviations. - And
a 99.6% chance that they’ll stay within 3 standard deviations.
But keep in mind that these probabilities are based on the
assumption of a normal distribution, which doesn’t always happen.
However, it gives us a clear indication of what the market
expects in terms of price swings.
Implied volatility is an annualized figure, but we can
convert it to a daily range like the ones we see below.
These levels on their own are quite handy, but when we
combine them with technical analysis tools like pivot points, or fibs, or
psychological levels, you can identify potential entry, take profit, or
stop-loss levels with more increased confidence.
What’s unique about using implied volatility is that it
provides a totally objective and data-dependent price range to complement your
subjective technical analysis.
ivol levels for today (10 April 2024)